

EpiTracer - an algorithm for identifying epicenters in condition-specific biological networks
- PMID: 27556637
- PMCID: PMC5001201
- DOI: 10.1186/s12864-016-2792-1
EpiTracer - an algorithm for identifying epicenters in condition-specific biological networks
Abstract
Background: In biological systems, diseases are caused by small perturbations in a complex network of interactions between proteins. Perturbations typically affect only a small number of proteins, which go on to disturb a larger part of the network. To counteract this, a stress-response is launched, resulting in a complex pattern of variations in the cell. Identifying the key players involved in either spreading the perturbation or responding to it can give us important insights.
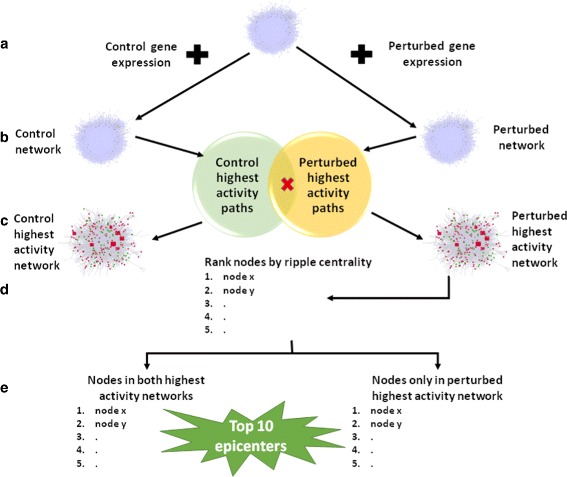
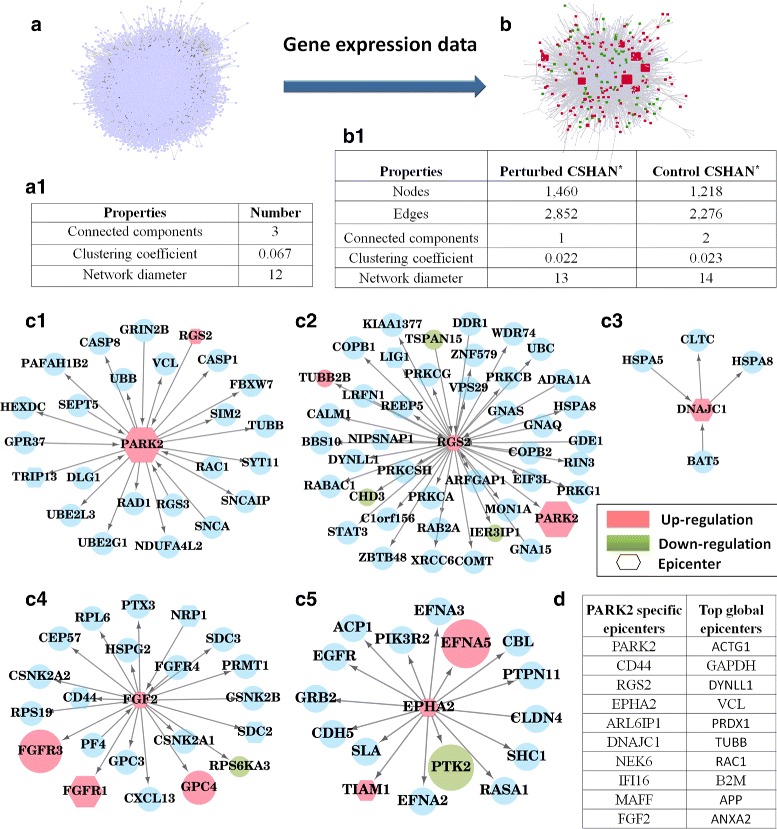
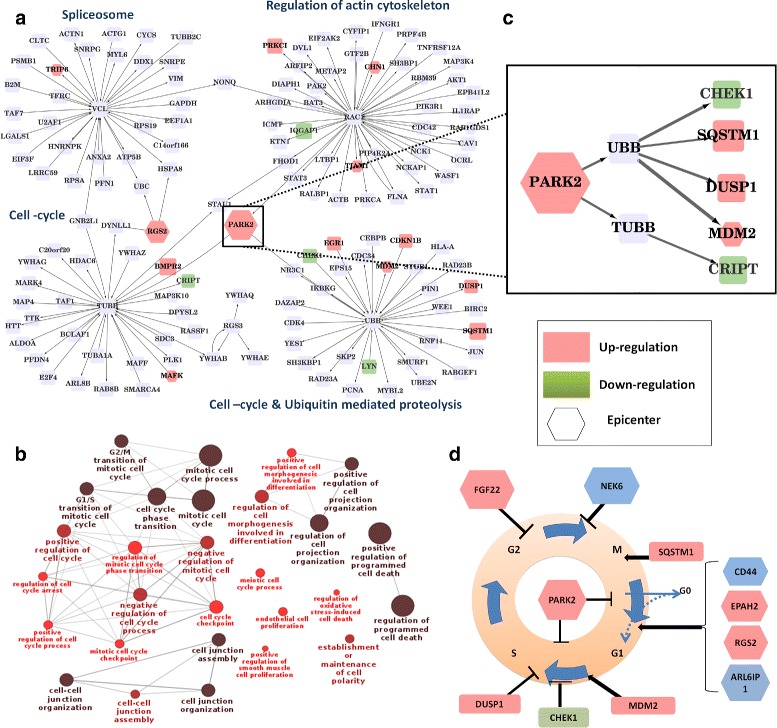
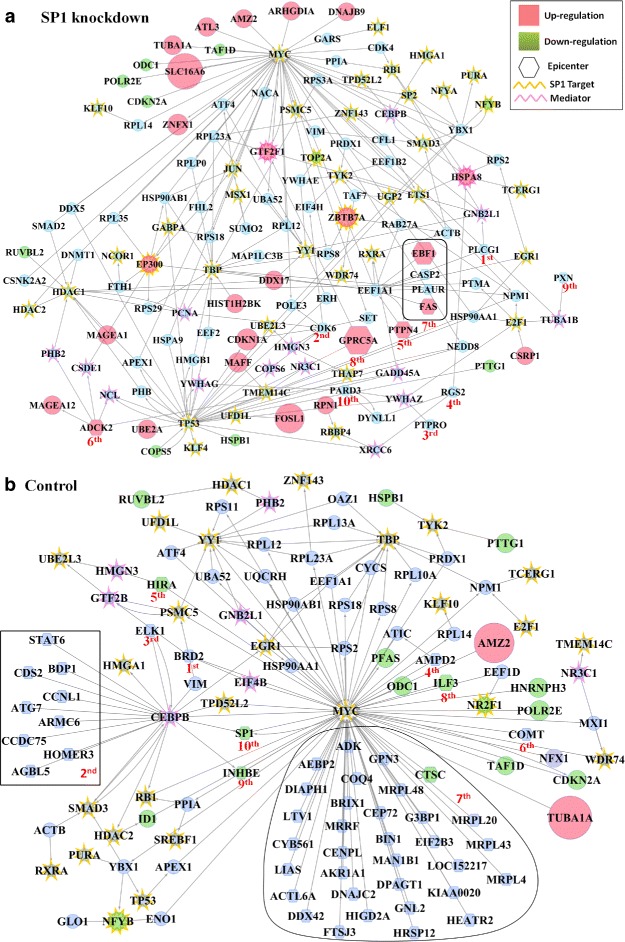
Results: We develop an algorithm, EpiTracer, which identifies the key proteins, or epicenters, from which a large number of changes in the protein-protein interaction (PPI) network ripple out. We propose a new centrality measure, ripple centrality, which measures how effectively a change at a particular node can ripple across the network by identifying highest activity paths specific to the condition of interest, obtained by mapping gene expression profiles to the PPI network. We demonstrate the algorithm using an overexpression study and a knockdown study. In the overexpression study, the gene that was overexpressed (PARK2) was highlighted as the most important epicenter specific to the perturbation. The other top-ranked epicenters were involved in either supporting the activity of PARK2, or counteracting it. Also, 5 of the identified epicenters showed no significant differential expression, showing that our method can find information which simple differential expression analysis cannot. In the second dataset (SP1 knockdown), alternative regulators of SP1 targets were highlighted as epicenters. Also, the gene that was knocked down (SP1) was picked up as an epicenter specific to the control condition. Sensitivity analysis showed that the genes identified as epicenters remain largely unaffected by small changes.
Conclusions: We develop an algorithm, EpiTracer, to find epicenters in condition-specific biological networks, given the PPI network and gene expression levels. EpiTracer includes programs which can extract the immediate influence zone of epicenters and provide a summary of dysregulated genes, facilitating quick biological analysis. We demonstrate its efficacy on two datasets with differing characteristics, highlighting its general applicability. We also show that EpiTracer is not sensitive to minor changes in the network. The source code for EpiTracer is provided at Github ( https://github.com/narmada26/EpiTracer ).
Keywords: Condition-specific network; Influential nodes; Network mining; Perturbation analysis; Ripple centrality.
Figures
Similar articles
-
Reconstructing directed gene regulatory network by only gene expression data.BMC Genomics. 2016 Aug 18;17 Suppl 4(Suppl 4):430. doi: 10.1186/s12864-016-2791-2. BMC Genomics. 2016. PMID: 27556418 Free PMC article.
-
Prioritizing disease genes with an improved dual label propagation framework.BMC Bioinformatics. 2018 Feb 8;19(1):47. doi: 10.1186/s12859-018-2040-6. BMC Bioinformatics. 2018. PMID: 29422030 Free PMC article.
-
A computational method using the random walk with restart algorithm for identifying novel epigenetic factors.Mol Genet Genomics. 2018 Feb;293(1):293-301. doi: 10.1007/s00438-017-1374-5. Epub 2017 Sep 20. Mol Genet Genomics. 2018. PMID: 28932904
-
Biological Network Inference and analysis using SEBINI and CABIN.Methods Mol Biol. 2009;541:551-76. doi: 10.1007/978-1-59745-243-4_24. Methods Mol Biol. 2009. PMID: 19381531 Review.
-
Mapping the common gene networks that underlie related diseases.Nat Protoc. 2023 Jun;18(6):1745-1759. doi: 10.1038/s41596-022-00797-1. Epub 2023 Jan 18. Nat Protoc. 2023. PMID: 36653526 Free PMC article. Review.
Cited by
-
Efficacy of β-lactam/β-lactamase inhibitor combination is linked to WhiB4-mediated changes in redox physiology of Mycobacterium tuberculosis.Elife. 2017 May 26;6:e25624. doi: 10.7554/eLife.25624. Elife. 2017. PMID: 28548640 Free PMC article.
-
Unbiased Identification of Blood-based Biomarkers for Pulmonary Tuberculosis by Modeling and Mining Molecular Interaction Networks.EBioMedicine. 2017 Feb;15:112-126. doi: 10.1016/j.ebiom.2016.12.009. Epub 2016 Dec 21. EBioMedicine. 2017. PMID: 28065665 Free PMC article.
-
Tracing the footsteps of autophagy in computational biology.Brief Bioinform. 2021 Jul 20;22(4):bbaa286. doi: 10.1093/bib/bbaa286. Brief Bioinform. 2021. PMID: 33201177 Free PMC article.
-
PathExt: a general framework for path-based mining of omics-integrated biological networks.Bioinformatics. 2021 Jun 9;37(9):1254-1262. doi: 10.1093/bioinformatics/btaa941. Bioinformatics. 2021. PMID: 33305329 Free PMC article.
-
A path-based analysis of infected cell line and COVID-19 patient transcriptome reveals novel potential targets and drugs against SARS-CoV-2.Res Sq [Preprint]. 2022 Mar 21:rs.3.rs-1474136. doi: 10.21203/rs.3.rs-1474136/v1. Res Sq. 2022. Update in: Front Immunol. 2022 Jul 01;13:918817. doi: 10.3389/fimmu.2022.918817. PMID: 35434729 Free PMC article. Updated. Preprint.
References
Publication types
MeSH terms
Substances
LinkOut - more resources
Full Text Sources
Other Literature Sources
