

Abundant Lysine Methylation and N-Terminal Acetylation in Sulfolobus islandicus Revealed by Bottom-Up and Top-Down Proteomics
- PMID: 27555370
- PMCID: PMC5098037
- DOI: 10.1074/mcp.M116.058073
Abundant Lysine Methylation and N-Terminal Acetylation in Sulfolobus islandicus Revealed by Bottom-Up and Top-Down Proteomics
Abstract
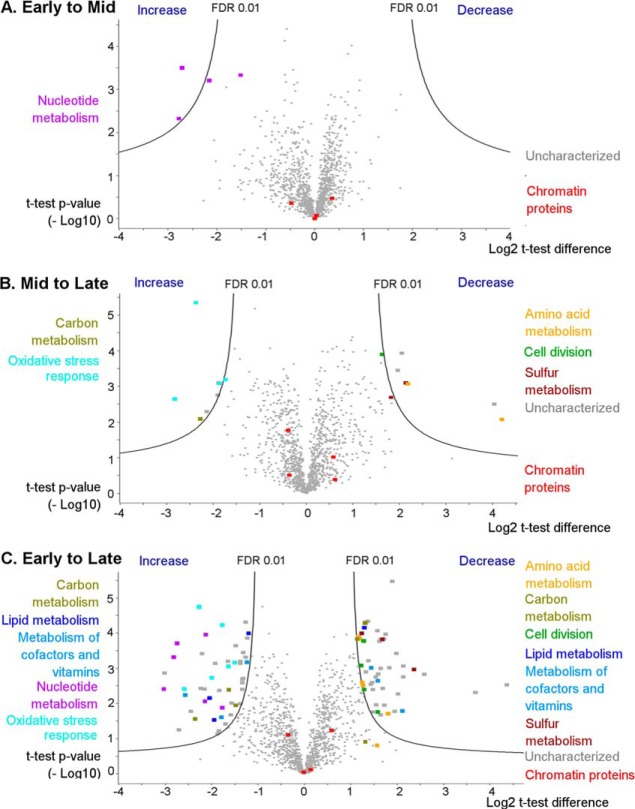
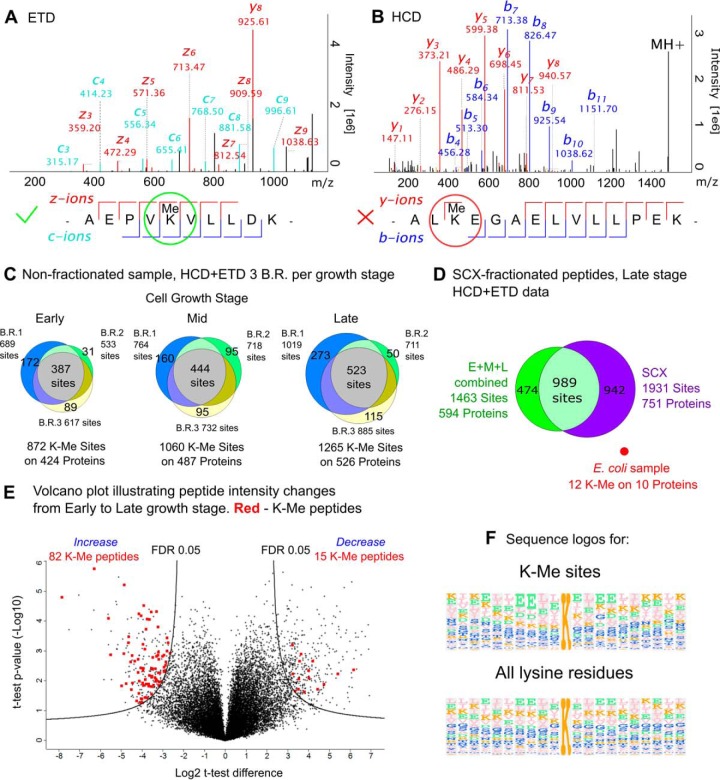
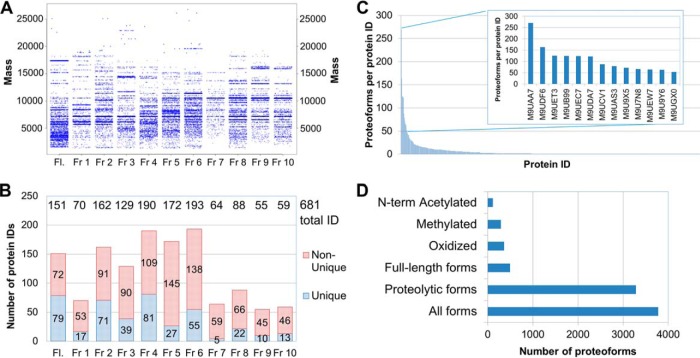
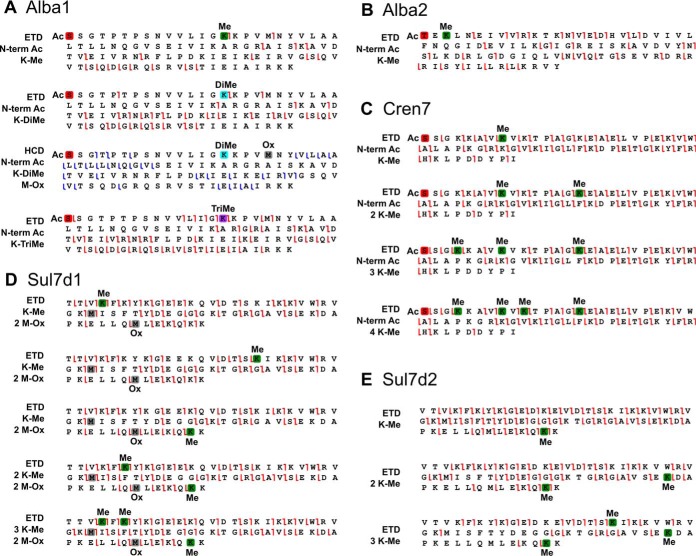
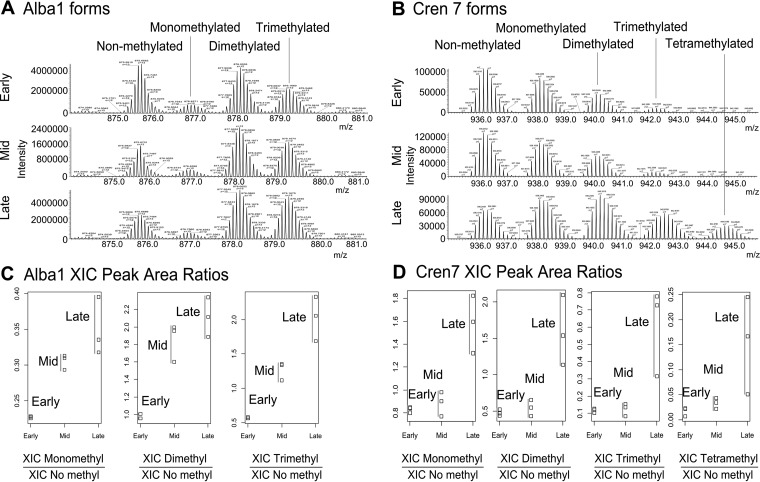
Protein post-translational methylation has been reported to occur in archaea, including members of the genus Sulfolobus, but has never been characterized on a proteome-wide scale. Among important Sulfolobus proteins carrying such modification are the chromatin proteins that have been described to be methylated on lysine side chains, resembling eukaryotic histones in that aspect. To get more insight into the extent of this modification and its dynamics during the different growth steps of the thermoacidophylic archaeon S. islandicus LAL14/1, we performed a global and deep proteomic analysis using a combination of high-throughput bottom-up and top-down approaches on a single high-resolution mass spectrometer. 1,931 methylation sites on 751 proteins were found by the bottom-up analysis, with methylation sites on 526 proteins monitored throughout three cell culture growth stages: early-exponential, mid-exponential, and stationary. The top-down analysis revealed 3,978 proteoforms arising from 681 proteins, including 292 methylated proteoforms, 85 of which were comprehensively characterized. Methylated proteoforms of the five chromatin proteins (Alba1, Alba2, Cren7, Sul7d1, Sul7d2) were fully characterized by a combination of bottom-up and top-down data. The top-down analysis also revealed an increase of methylation during cell growth for two chromatin proteins, which had not been evidenced by bottom-up. These results shed new light on the ubiquitous lysine methylation throughout the S. islandicus proteome. Furthermore, we found that S. islandicus proteins are frequently acetylated at the N terminus, following the removal of the N-terminal methionine. This study highlights the great value of combining bottom-up and top-down proteomics for obtaining an unprecedented level of accuracy in detecting differentially modified intact proteoforms. The data have been deposited to the ProteomeXchange with identifiers PXD003074 and PXD004179.
© 2016 by The American Society for Biochemistry and Molecular Biology, Inc.
Figures
Similar articles
-
Functional Insights Into Protein Acetylation in the Hyperthermophilic Archaeon Sulfolobus islandicus.Mol Cell Proteomics. 2019 Aug;18(8):1572-1587. doi: 10.1074/mcp.RA119.001312. Epub 2019 Jun 9. Mol Cell Proteomics. 2019. PMID: 31182439 Free PMC article.
-
aKMT Catalyzes Extensive Protein Lysine Methylation in the Hyperthermophilic Archaeon Sulfolobus islandicus but is Dispensable for the Growth of the Organism.Mol Cell Proteomics. 2016 Sep;15(9):2908-23. doi: 10.1074/mcp.M115.057778. Epub 2016 Jun 21. Mol Cell Proteomics. 2016. PMID: 27329856 Free PMC article.
-
Top Down Proteomics Reveals Mature Proteoforms Expressed in Subcellular Fractions of the Echinococcus granulosus Preadult Stage.J Proteome Res. 2015 Nov 6;14(11):4805-14. doi: 10.1021/acs.jproteome.5b00642. Epub 2015 Oct 28. J Proteome Res. 2015. PMID: 26465659 Free PMC article.
-
Protein acetylation in archaea, bacteria, and eukaryotes.Archaea. 2010 Sep 16;2010:820681. doi: 10.1155/2010/820681. Archaea. 2010. PMID: 20885971 Free PMC article. Review.
-
The ubiquitin proteoform problem.Curr Opin Chem Biol. 2021 Aug;63:95-104. doi: 10.1016/j.cbpa.2021.02.015. Epub 2021 Apr 1. Curr Opin Chem Biol. 2021. PMID: 33813043 Free PMC article. Review.
Cited by
-
Lysine Methylation Modulates the Interaction of Archaeal Chromatin Protein Cren7 With DNA.Front Microbiol. 2022 Mar 3;13:837737. doi: 10.3389/fmicb.2022.837737. eCollection 2022. Front Microbiol. 2022. PMID: 35308404 Free PMC article.
-
A novel RHH family transcription factor aCcr1 and its viral homologs dictate cell cycle progression in archaea.Nucleic Acids Res. 2023 Feb 28;51(4):1707-1723. doi: 10.1093/nar/gkad006. Nucleic Acids Res. 2023. PMID: 36715325 Free PMC article.
-
Characterization of Lysine Monomethylome and Methyltransferase in Model Cyanobacterium Synechocystis sp. PCC 6803.Genomics Proteomics Bioinformatics. 2020 Jun;18(3):289-304. doi: 10.1016/j.gpb.2019.04.005. Epub 2020 Oct 30. Genomics Proteomics Bioinformatics. 2020. PMID: 33130100 Free PMC article.
-
Functional Insights Into Protein Acetylation in the Hyperthermophilic Archaeon Sulfolobus islandicus.Mol Cell Proteomics. 2019 Aug;18(8):1572-1587. doi: 10.1074/mcp.RA119.001312. Epub 2019 Jun 9. Mol Cell Proteomics. 2019. PMID: 31182439 Free PMC article.
-
Post-Translational Modifications Aid Archaeal Survival.Biomolecules. 2020 Apr 10;10(4):584. doi: 10.3390/biom10040584. Biomolecules. 2020. PMID: 32290118 Free PMC article. Review.
References
-
- Kashefi K., and Lovley D. R. (2003) Extending the Upper Temperature Limit for Life. Science 301, 934. - PubMed
-
- Schleper C., Puehler G., Holz I., Gambacorta A., Janekovic D., Santarius U., Klenk H. P., and Zillig W. (1995) Picrophilus gen. nov., fam. nov.: a novel aerobic, heterotrophic, thermoacidophilic genus and family comprising archaea capable of growth around pH 0. J. Bacteriol. 177, 7050–7059 - PMC - PubMed
MeSH terms
Substances
LinkOut - more resources
Full Text Sources
Other Literature Sources
Molecular Biology Databases
