

Discovery of LRE1 as a specific and allosteric inhibitor of soluble adenylyl cyclase
- PMID: 27547922
- PMCID: PMC5030147
- DOI: 10.1038/nchembio.2151
Discovery of LRE1 as a specific and allosteric inhibitor of soluble adenylyl cyclase
Abstract
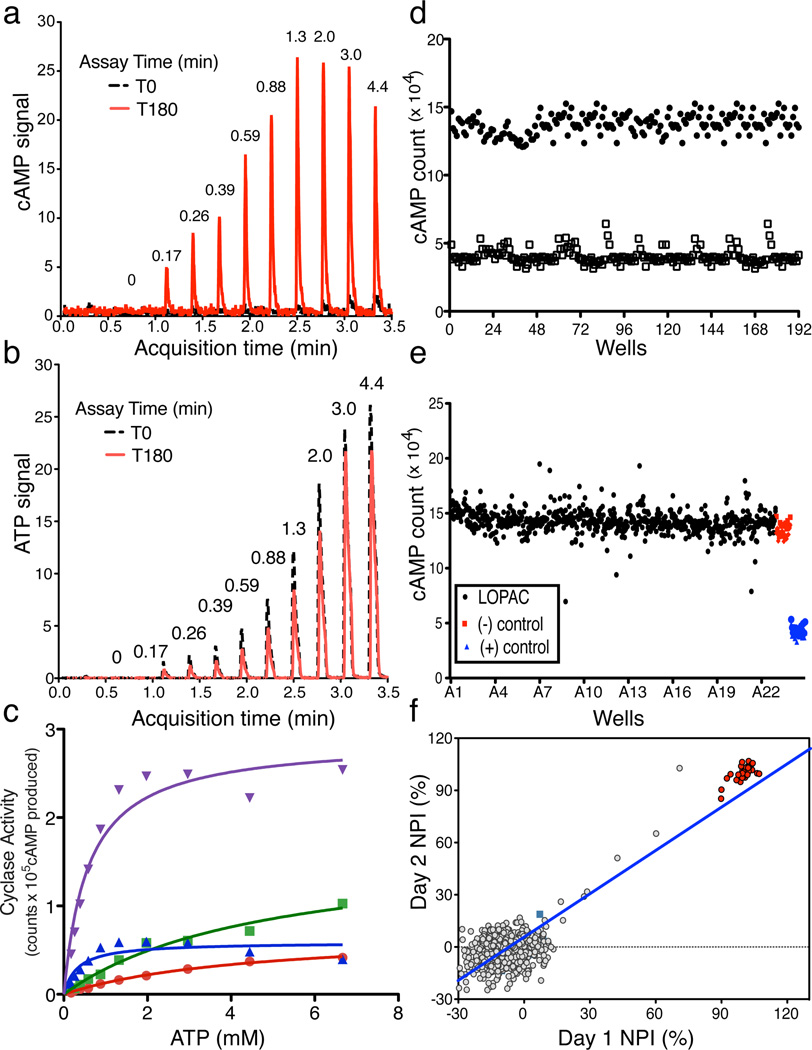
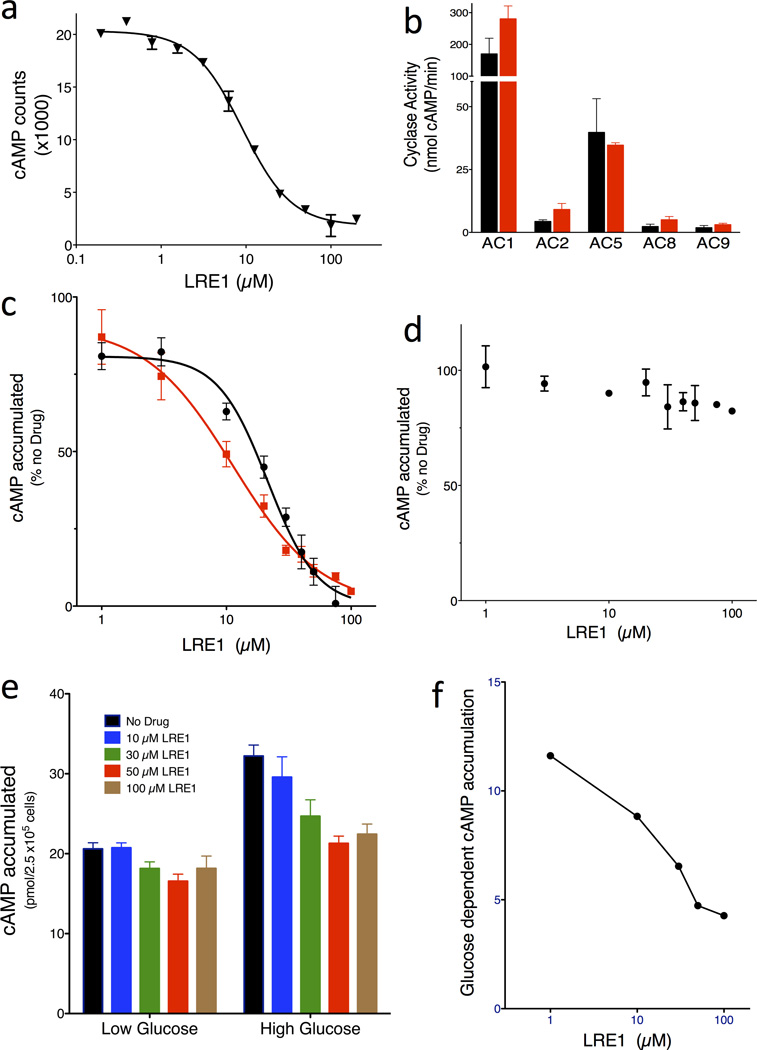
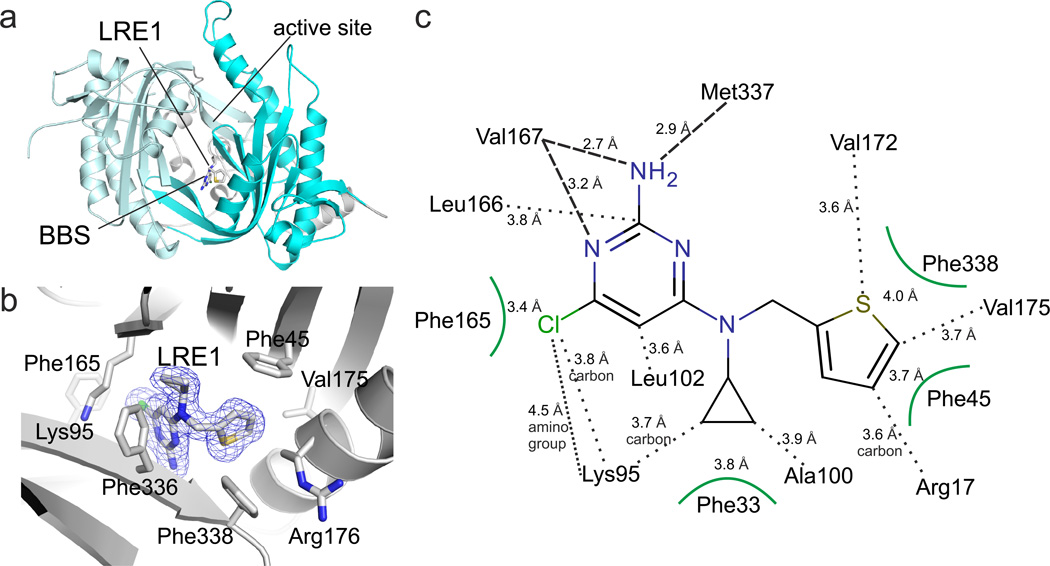
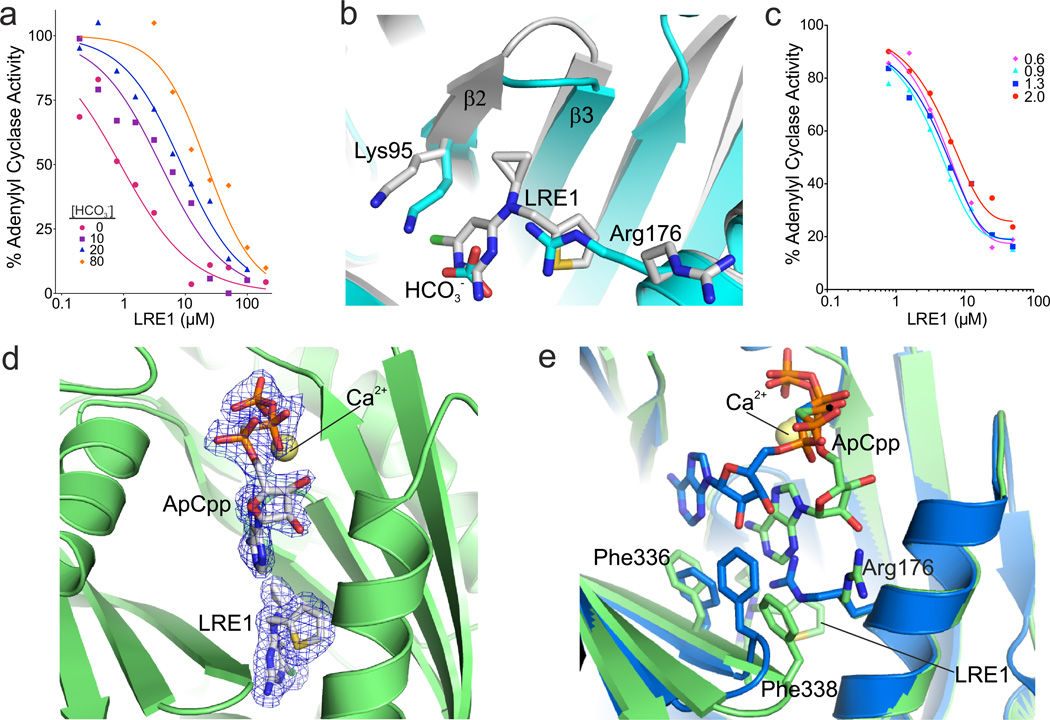
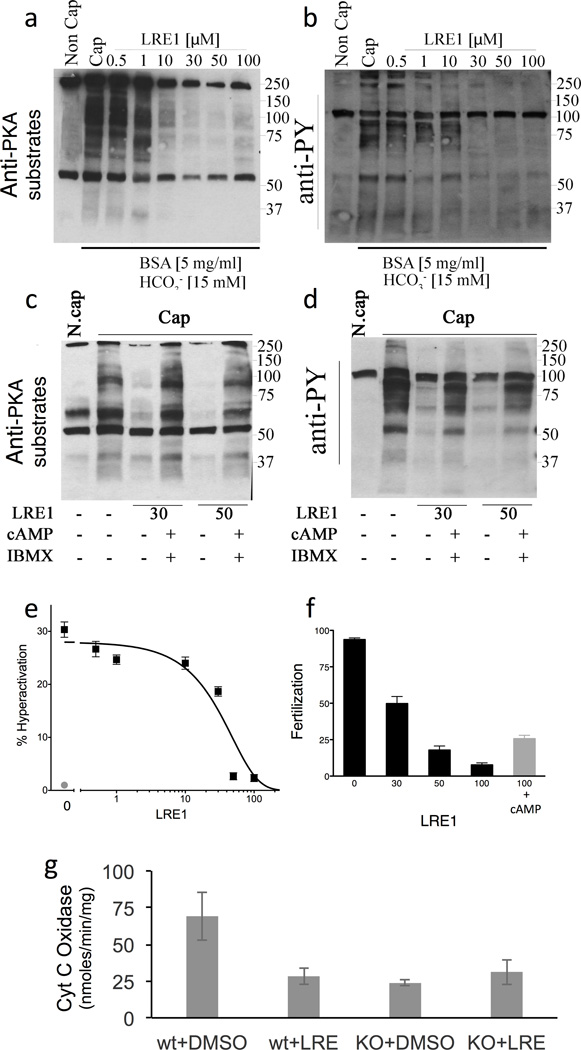
The prototypical second messenger cAMP regulates a wide variety of physiological processes. It can simultaneously mediate diverse functions by acting locally in independently regulated microdomains. In mammalian cells, two types of adenylyl cyclase generate cAMP: G-protein-regulated transmembrane adenylyl cyclases and bicarbonate-, calcium- and ATP-regulated soluble adenylyl cyclase (sAC). Because each type of cyclase regulates distinct microdomains, methods to distinguish between them are needed to understand cAMP signaling. We developed a mass-spectrometry-based adenylyl cyclase assay, which we used to identify a new sAC-specific inhibitor, LRE1. LRE1 bound to the bicarbonate activator binding site and inhibited sAC via a unique allosteric mechanism. LRE1 prevented sAC-dependent processes in cellular and physiological systems, and it will facilitate exploration of the therapeutic potential of sAC inhibition.
Conflict of interest statement
Drs. Buck, Levin and Zippin own equity interest in CEP Biotech which has licensed commercialization of a panel of monoclonal antibodies directed against sAC. All other authors declare that they have no conflicts of interest with the contents of this article.
Figures
Similar articles
-
International Union of Basic and Clinical Pharmacology. CI. Structures and Small Molecule Modulators of Mammalian Adenylyl Cyclases.Pharmacol Rev. 2017 Apr;69(2):93-139. doi: 10.1124/pr.116.013078. Pharmacol Rev. 2017. PMID: 28255005 Free PMC article. Review.
-
A sperm-specific Na+/H+ exchanger (sNHE) is critical for expression and in vivo bicarbonate regulation of the soluble adenylyl cyclase (sAC).Proc Natl Acad Sci U S A. 2007 May 29;104(22):9325-30. doi: 10.1073/pnas.0611296104. Epub 2007 May 17. Proc Natl Acad Sci U S A. 2007. PMID: 17517652 Free PMC article.
-
Functional and pathological roles of adenylyl cyclases in various diseases.Int J Biol Macromol. 2024 Nov;281(Pt 1):136198. doi: 10.1016/j.ijbiomac.2024.136198. Epub 2024 Oct 2. Int J Biol Macromol. 2024. PMID: 39366614 Review.
-
Depressing time: Waiting, melancholia, and the psychoanalytic practice of care.In: Kirtsoglou E, Simpson B, editors. The Time of Anthropology: Studies of Contemporary Chronopolitics. Abingdon: Routledge; 2020. Chapter 5. In: Kirtsoglou E, Simpson B, editors. The Time of Anthropology: Studies of Contemporary Chronopolitics. Abingdon: Routledge; 2020. Chapter 5. PMID: 36137063 Free Books & Documents. Review.
-
Comparison of Two Modern Survival Prediction Tools, SORG-MLA and METSSS, in Patients With Symptomatic Long-bone Metastases Who Underwent Local Treatment With Surgery Followed by Radiotherapy and With Radiotherapy Alone.Clin Orthop Relat Res. 2024 Dec 1;482(12):2193-2208. doi: 10.1097/CORR.0000000000003185. Epub 2024 Jul 23. Clin Orthop Relat Res. 2024. PMID: 39051924
Cited by
-
Design, Synthesis, and Pharmacological Evaluation of Second-Generation Soluble Adenylyl Cyclase (sAC, ADCY10) Inhibitors with Slow Dissociation Rates.J Med Chem. 2022 Nov 24;65(22):15208-15226. doi: 10.1021/acs.jmedchem.2c01133. Epub 2022 Nov 8. J Med Chem. 2022. PMID: 36346696 Free PMC article.
-
Structural basis of adenylyl cyclase 9 activation.Nat Commun. 2022 Feb 24;13(1):1045. doi: 10.1038/s41467-022-28685-y. Nat Commun. 2022. PMID: 35210418 Free PMC article.
-
Sperm capacitation is associated with phosphorylation of the testis-specific radial spoke protein Rsph6a†.Biol Reprod. 2019 Feb 1;100(2):440-454. doi: 10.1093/biolre/ioy202. Biol Reprod. 2019. PMID: 30239614 Free PMC article.
-
Melatonin: Both a Messenger of Darkness and a Participant in the Cellular Actions of Non-Visible Solar Radiation of Near Infrared Light.Biology (Basel). 2023 Jan 6;12(1):89. doi: 10.3390/biology12010089. Biology (Basel). 2023. PMID: 36671781 Free PMC article. Review.
-
Optimization of lead compounds into on-demand, nonhormonal contraceptives: leveraging a public-private drug discovery institute collaboration†.Biol Reprod. 2020 Aug 4;103(2):176-182. doi: 10.1093/biolre/ioaa052. Biol Reprod. 2020. PMID: 32307523 Free PMC article.
References
-
- Steegborn C. Structure, mechanism, and regulation of soluble adenylyl cyclases - similarities and differences to transmembrane adenylyl cyclases. Biochim Biophys Acta. 2014;1842:2535–2547. - PubMed
-
- Levin LR, Buck J. Physiological roles of acid-base sensors. Annu Rev Physiol. 2015;77:347–362. - PubMed
Publication types
MeSH terms
Substances
Associated data
Grants and funding
LinkOut - more resources
Full Text Sources
Other Literature Sources
Molecular Biology Databases
Research Materials
