Optical coherence microscopy in 1700 nm spectral band for high-resolution label-free deep-tissue imaging
- PMID: 27546517
- PMCID: PMC4992836
- DOI: 10.1038/srep31715
Optical coherence microscopy in 1700 nm spectral band for high-resolution label-free deep-tissue imaging
Abstract
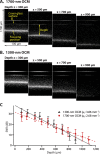
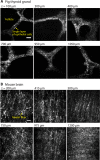
Optical coherence microscopy (OCM) is a label-free, high-resolution, three-dimensional (3D) imaging technique based on optical coherence tomography (OCT) and confocal microscopy. Here, we report that the 1700-nm spectral band has the great potential to improve the imaging depth in high-resolution OCM imaging of animal tissues. Recent studies to improve the imaging depth in OCT revealed that the 1700-nm spectral band is a promising choice for imaging turbid scattering tissues due to the low attenuation of light in the wavelength region. In this study, we developed high-resolution OCM by using a high-power supercontinuum source in the 1700-nm spectral band, and compared the attenuation of signal-to-noise ratio between the 1700-nm and 1300-nm OCM imaging of a mouse brain under the condition of the same sensitivity. The comparison clearly showed that the 1700-nm OCM provides larger imaging depth than the 1300-nm OCM. In this 1700-nm OCM, the lateral resolution of 1.3 μm and the axial resolution of 2.8 μm, when a refractive index was assumed to be 1.38, was achieved.
Figures


Similar articles
-
Signal-to-background ratio and lateral resolution in deep tissue imaging by optical coherence microscopy in the 1700 nm spectral band.Sci Rep. 2019 Nov 5;9(1):16041. doi: 10.1038/s41598-019-52175-9. Sci Rep. 2019. PMID: 31690729 Free PMC article.
-
High-spatial-resolution deep tissue imaging with spectral-domain optical coherence microscopy in the 1700-nm spectral band.J Biomed Opt. 2019 Jul;24(7):1-4. doi: 10.1117/1.JBO.24.7.070502. J Biomed Opt. 2019. PMID: 31364330 Free PMC article.
-
Simultaneous dual-band optical coherence tomography in the spectral domain for high resolution in vivo imaging.Opt Express. 2009 Oct 26;17(22):19486-500. doi: 10.1364/OE.17.019486. Opt Express. 2009. PMID: 19997169
-
Multimodal optical imaging with multiphoton microscopy and optical coherence tomography.J Biophotonics. 2012 May;5(5-6):396-403. doi: 10.1002/jbio.201100138. Epub 2012 Mar 28. J Biophotonics. 2012. PMID: 22461146 Review.
-
Application of anterior segment optical coherence tomography in glaucoma.Surv Ophthalmol. 2014 May-Jun;59(3):311-27. doi: 10.1016/j.survophthal.2013.06.005. Epub 2013 Oct 15. Surv Ophthalmol. 2014. PMID: 24138894 Review.
Cited by
-
Uncovering the biology of myelin with optical imaging of the live brain.Glia. 2019 Nov;67(11):2008-2019. doi: 10.1002/glia.23635. Epub 2019 Apr 29. Glia. 2019. PMID: 31033062 Free PMC article. Review.
-
Enhanced microvascular imaging through deep learning-driven OCTA reconstruction with squeeze-and-excitation block integration.Biomed Opt Express. 2024 Sep 3;15(10):5592-5608. doi: 10.1364/BOE.525928. eCollection 2024 Oct 1. Biomed Opt Express. 2024. PMID: 39421773 Free PMC article.
-
Deep brain optical coherence tomography angiography in mice: in vivo, noninvasive imaging of hippocampal formation.Sci Rep. 2018 Aug 2;8(1):11614. doi: 10.1038/s41598-018-29975-6. Sci Rep. 2018. PMID: 30072791 Free PMC article.
-
Signal-to-background ratio and lateral resolution in deep tissue imaging by optical coherence microscopy in the 1700 nm spectral band.Sci Rep. 2019 Nov 5;9(1):16041. doi: 10.1038/s41598-019-52175-9. Sci Rep. 2019. PMID: 31690729 Free PMC article.
-
Noninvasive, in vivo rodent brain optical coherence tomography at 2.1 microns.Opt Lett. 2019 Sep 1;44(17):4147-4150. doi: 10.1364/OL.44.004147. Opt Lett. 2019. PMID: 31465349 Free PMC article.
References
MeSH terms
LinkOut - more resources
Full Text Sources
Other Literature Sources

