The Tp0684 (MglB-2) Lipoprotein of Treponema pallidum: A Glucose-Binding Protein with Divergent Topology
- PMID: 27536942
- PMCID: PMC4990184
- DOI: 10.1371/journal.pone.0161022
The Tp0684 (MglB-2) Lipoprotein of Treponema pallidum: A Glucose-Binding Protein with Divergent Topology
Abstract
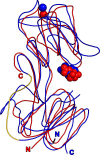
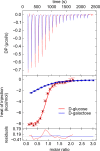
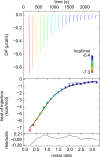
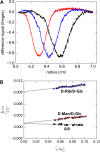
Treponema pallidum, the bacterium that causes syphilis, is an obligate human parasite. As such, it must acquire energy, in the form of carbon sources, from the host. There is ample evidence that the principal source of energy for this spirochete is D-glucose acquired from its environment, likely via an ABC transporter. Further, there is genetic evidence of a D-glucose chemotaxis system in T. pallidum. Both of these processes may be dependent on a single lipidated chemoreceptor: Tp0684, also called TpMglB-2 for its sequence homology to MglB of Escherichia coli. To broaden our understanding of this potentially vital protein, we determined a 2.05-Å X-ray crystal structure of a soluble form of the recombinant protein. Like its namesake, TpMglB-2 adopts a bilobed fold that is similar to that of the ligand-binding proteins (LBPs) of other ABC transporters. However, the protein has an unusual, circularly permuted topology. This feature prompted a series of biophysical studies that examined whether the protein's topological distinctiveness affected its putative chemoreceptor functions. Differential scanning fluorimetry and isothermal titration calorimetry were used to confirm that the protein bound D-glucose in a cleft between its two lobes. Additionally, analytical ultracentrifugation was employed to reveal that D-glucose binding is accompanied by a significant conformational change. TpMglB-2 thus appears to be fully functional in vitro, and given the probable central importance of the protein to T. pallidum's physiology, our results have implications for the viability and pathogenicity of this obligate human pathogen.
Conflict of interest statement
Figures


Similar articles
-
Crystal stuctures of MglB-2 (TP0684), a topologically variant d-glucose-binding protein from Treponema pallidum, reveal a ligand-induced conformational change.Protein Sci. 2018 Apr;27(4):880-885. doi: 10.1002/pro.3373. Epub 2018 Feb 1. Protein Sci. 2018. PMID: 29318719 Free PMC article.
-
The Tp38 (TpMglB-2) lipoprotein binds glucose in a manner consistent with receptor function in Treponema pallidum.J Bacteriol. 2004 Apr;186(8):2303-8. doi: 10.1128/JB.186.8.2303-2308.2004. J Bacteriol. 2004. PMID: 15060032 Free PMC article.
-
The PnrA (Tp0319; TmpC) lipoprotein represents a new family of bacterial purine nucleoside receptor encoded within an ATP-binding cassette (ABC)-like operon in Treponema pallidum.J Biol Chem. 2006 Mar 24;281(12):8072-81. doi: 10.1074/jbc.M511405200. Epub 2006 Jan 16. J Biol Chem. 2006. PMID: 16418175
-
Polypeptides of Treponema pallidum: progress toward understanding their structural, functional, and immunologic roles. Treponema Pallidum Polypeptide Research Group.Microbiol Rev. 1993 Sep;57(3):750-79. doi: 10.1128/mr.57.3.750-779.1993. Microbiol Rev. 1993. PMID: 8246847 Free PMC article. Review.
-
Treponema pallidum, the syphilis spirochete: making a living as a stealth pathogen.Nat Rev Microbiol. 2016 Dec;14(12):744-759. doi: 10.1038/nrmicro.2016.141. Epub 2016 Oct 10. Nat Rev Microbiol. 2016. PMID: 27721440 Free PMC article. Review.
Cited by
-
Tp0684, Tp0750, and Tp0792 Recombinant Proteins as Antigens for the Serodiagnosis of Syphilis.Indian J Microbiol. 2022 Sep;62(3):419-427. doi: 10.1007/s12088-022-01017-w. Epub 2022 Apr 19. Indian J Microbiol. 2022. PMID: 35974924 Free PMC article.
-
Investigation of syphilis immunology and Treponema pallidum subsp. pallidum biology to improve clinical management and design a broadly protective vaccine: study protocol.BMC Infect Dis. 2020 Jun 23;20(1):444. doi: 10.1186/s12879-020-05141-0. BMC Infect Dis. 2020. PMID: 32576149 Free PMC article.
-
Evidence that immunization with TP0751, a bipartite Treponema pallidum lipoprotein with an intrinsically disordered region and lipocalin fold, fails to protect in the rabbit model of experimental syphilis.PLoS Pathog. 2020 Sep 16;16(9):e1008871. doi: 10.1371/journal.ppat.1008871. eCollection 2020 Sep. PLoS Pathog. 2020. PMID: 32936831 Free PMC article.
-
Advancements in the development of nucleic acid vaccines for syphilis prevention and control.Hum Vaccin Immunother. 2023 Aug 1;19(2):2234790. doi: 10.1080/21645515.2023.2234790. Hum Vaccin Immunother. 2023. PMID: 37538024 Free PMC article. Review.
-
The Treponema pallidum Outer Membrane.Curr Top Microbiol Immunol. 2018;415:1-38. doi: 10.1007/82_2017_44. Curr Top Microbiol Immunol. 2018. PMID: 28849315 Free PMC article. Review.
References
-
- Simms I, Fenton KA, Ashton M, Turner KME, Crawley-Boevey EE, Gorton R, et al. The Re-Emergence of Syphilis in the United Kingdom: The New Epidemic Phases. Sex Transm Dis. 2005;32: 220–226. - PubMed
-
- Golden MR, Marra CM, Holmes KK. Update on syphilis: resurgence of an old problem. J Am Med Assoc. 2003;290: 1510–1514. - PubMed
-
- Bremer V, Marcus U, Hamouda O. Syphilis on the rise again in Germany–results from surveillance data for 2011. Sex Transm Dis. 2012; 7–11. - PubMed
-
- Velicko I, Unemo M. Recent trends in gonorrhoea and syphilis epidemiology in Sweden: 2007 to 2011. Control. 2012; 1–6. - PubMed
-
- Mattei PL, Beachkofsky TM, Gilson RT, Wisco OJ. Syphilis: a reemerging infection. Am Fam Physician. 2012;86: 433–440. - PubMed
MeSH terms
Substances
Grants and funding
LinkOut - more resources
Full Text Sources
Other Literature Sources
Research Materials

