Comprehensive N-glycan profiles of hepatocellular carcinoma reveal association of fucosylation with tumor progression and regulation of FUT8 by microRNAs
- PMID: 27533464
- PMCID: PMC5308645
- DOI: 10.18632/oncotarget.11284
Comprehensive N-glycan profiles of hepatocellular carcinoma reveal association of fucosylation with tumor progression and regulation of FUT8 by microRNAs
Abstract
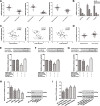
Glycosylation has significant effects on cancer progression. Fucosylation is one of the most important glycosylation events involved in hepatocellular carcinoma (HCC). Here, we compared N-glycan profiles of liver tumor tissues and adjacent tissues of 27 HCC patients to reveal the association between fucosylation and HCC progression, as well as verified the potential role of miRNA in regulating fucosylation. Mass spectrometry (MS) analysis showed pronounced differences of the N-glycosylation patterns and fucosylated N-glycans between the adjacent and tumor tissues. Different fucosyltransferase (FUT) genes were also identified in adjacent and tumor tissues, and two HCC cell lines with different metastatic potential. High-level expression of FUT8 was detected in tumor tissues and highly metastatic HCC cells. Altered levels of FUT8 in HCC cell lines significantly linked to the malignant behaviors of proliferation and invasion in vitro. Furthermore, using microRNA array, we identified FUT8 as one of the miR-26a, miR-34a and miR-146a-targeted genes. An inverse correlation was revealed between the expression levels of FUT8 and these miRNAs. Luciferase reporter assay demonstrated these miRNAs specifically interacted with the 3'UTR of FUT8 and subsequently down-regulated FUT8 expression-level. The forced expression of these miRNAs was able to induce a decrease in FUT8 levels and thereby to suppress HCC cells progression. Altogether, our results indicate that fucosylated N-glycan and FUT8 levels can be used as markers for evaluating HCC progression, as well as miRNAs may be involved in inhibition of fucosylation machinery through targeting FUT8.
Keywords: fucosyltransferase (FUT) gene; human hepatocellular carcinoma cell lines; microRNAs; tumor progression.
Conflict of interest statement
The authors declare no conflicts of interest.
Figures


Similar articles
-
Effects of microRNAs on fucosyltransferase 8 (FUT8) expression in hepatocarcinoma cells.PLoS One. 2013 Oct 9;8(10):e76540. doi: 10.1371/journal.pone.0076540. eCollection 2013. PLoS One. 2013. PMID: 24130780 Free PMC article.
-
Caveolin-1 upregulates Fut8 expression by activating the Wnt/β-catenin pathway to enhance HCC cell proliferative and invasive ability.Cell Biol Int. 2020 Nov;44(11):2202-2212. doi: 10.1002/cbin.11426. Epub 2020 Aug 8. Cell Biol Int. 2020. PMID: 32710651
-
Functional roles of sialylation in breast cancer progression through miR-26a/26b targeting ST8SIA4.Cell Death Dis. 2016 Dec 29;7(12):e2561. doi: 10.1038/cddis.2016.427. Cell Death Dis. 2016. PMID: 28032858 Free PMC article.
-
FUT8 Alpha-(1,6)-Fucosyltransferase in Cancer.Int J Mol Sci. 2021 Jan 5;22(1):455. doi: 10.3390/ijms22010455. Int J Mol Sci. 2021. PMID: 33466384 Free PMC article. Review.
-
Distinctive domains and activity regulation of core fucosylation enzyme FUT8.Biochim Biophys Acta Gen Subj. 2024 Apr;1868(4):130561. doi: 10.1016/j.bbagen.2024.130561. Epub 2024 Jan 12. Biochim Biophys Acta Gen Subj. 2024. PMID: 38218458 Review.
Cited by
-
The Multifaceted Role of FUT8 in Tumorigenesis: From Pathways to Potential Clinical Applications.Int J Mol Sci. 2024 Jan 15;25(2):1068. doi: 10.3390/ijms25021068. Int J Mol Sci. 2024. PMID: 38256141 Free PMC article. Review.
-
Overview of distinct 5-methylcytosine profiles of messenger RNA in human hepatocellular carcinoma and paired adjacent non-tumor tissues.J Transl Med. 2020 Jun 22;18(1):245. doi: 10.1186/s12967-020-02417-6. J Transl Med. 2020. PMID: 32571340 Free PMC article.
-
Stable overexpression of native and artificial miRNAs for the production of differentially fucosylated antibodies in CHO cells.Eng Life Sci. 2024 Apr 1;24(6):2300234. doi: 10.1002/elsc.202300234. eCollection 2024 Jun. Eng Life Sci. 2024. PMID: 38845814 Free PMC article.
-
The comprehensive landscape of miR-34a in cancer research.Cancer Metastasis Rev. 2021 Sep;40(3):925-948. doi: 10.1007/s10555-021-09973-3. Epub 2021 May 6. Cancer Metastasis Rev. 2021. PMID: 33959850 Review.
-
FUT8 and Protein Core Fucosylation in Tumours: From Diagnosis to Treatment.J Cancer. 2021 May 13;12(13):4109-4120. doi: 10.7150/jca.58268. eCollection 2021. J Cancer. 2021. PMID: 34093814 Free PMC article. Review.
References
-
- Block TM, Mehta AS, Fimmel CJ, Jordan R. Molecular viral oncology of hepatocellular carcinoma. Oncogene. 2003;22:5093–5107. - PubMed
-
- Lis H, Sharon N. Protein glycosylation. Structural and functional aspects. Eur J Biochem. 1993;218:1–27. - PubMed
-
- Adamczyk B, Tharmalingam T, Rudd PM. Glycans as cancer biomarkers. Biochim Biophys Acta. 2012;1820:1347–1353. - PubMed
MeSH terms
Substances
LinkOut - more resources
Full Text Sources
Other Literature Sources
Medical

