. 2017 Jan;101(1):339-350.
doi: 10.1189/jlb.4A0516-216R. Epub 2016 Aug 16.

Differential effects of HIV transmission from monocyte-derived dendritic cells vs. monocytes to IL-17+CD4+ T cells

Affiliations

Differential effects of HIV transmission from monocyte-derived dendritic cells vs. monocytes to IL-17+CD4+ T cells

Yu-Ya Mitsuki et al. J Leukoc Biol. 2017 Jan.

Abstract

HIV infection leads to CD4 helper T cell (Th) loss, but not all Th cells are equally depleted. The contribution of other immune cells in the Th depletion also remains unclear. This study investigates HIV transmission from monocyte-derived dendritic cells (MDDCs) vs. monocytes to Th17 and Th1 cells using an allogeneic coculture model. The addition of HIV to MDDCs increased the expression of the negative regulatory molecule PD-L1 and decreased the expression of the activation markers HLA-DR and CD86, whereas the virus up-regulated HLA-DR and CD86, but not PD-L1, on monocytes. Coculturing of CD4+ T cells with MDDCs pretreated with HIV led to the decline of Th17, but not Th1, responses. In contrast, pretreatment of monocytes with HIV increased Th17 without affecting Th1 responses. The enhanced Th17 responses in the cocultures with HIV-treated monocytes were also accompanied by high numbers of virus-infected CD4+ T cells. The Th17 expansion arose from memory CD4+ T cells with minimal contribution from naïve CD4+ T cells. The Th17-enhancing activity was mediated by the HIV envelope and did not require productive virus infection. Comparison of MDDCs and monocytes further showed that, although HIV-treated MDDCs reduced Th proliferation and increased the activation of the apoptosis mediator caspase-3, HIV-treated monocytes enhanced Th proliferation without increasing the active caspase-3 levels. This study indicates the potential role of distinct myeloid cell populations in shaping Th17 responses during HIV infection.

Keywords: HIV envelope; Th1; Th17.


Figures

Figure 1.
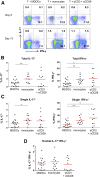
Figure 1.. IL-17 and IFN-γ responses in CD4+ T cell cultures with different stimuli.
Purified CD4+ T cells were cultured with allogeneic monocytes or MDDCs at a T cell/APC ratio of 5:1 or stimulated with a combination of anti-CD3 (2 µg/ml; eBioscience) and anti-CD28 (2 µg/ml; eBioscience) Abs. At d 5 and 13, these CD4+ T cells were stimulated with PMA and ionomycin, followed by intracellular staining with anti-IL-17 and IFN-γ Abs. The frequencies of IL-17+ cells and IFN-γ+ cells were determined by flow cytometry. (A) Dot plots from one representative subject showing IL-17 and IFN-γ expression in the CD4+ T cells. (B–D) Cumulative data showing the percentages of total IL-17+ (B, left panel) and IFN-γ+ (B, right panel), single-positive IL-17+ (C, left panel), single-positive IFN-γ+ (C, right panel), and double-positive IL-17+IFN-γ+ (D) cells out of CD4+ T cells in the cultures from different donors. The red bars represent means. P values were calculated using the unpaired t test. *P < 0.05, **P < 0.01.
Figure 2.
Figure 2.. HIV-induced alterations of cytokine secretion and regulatory molecule expression in MDDCs vs. monocytes.
MDDCs or monocytes were treated with SF162 (MOI = 0.5) or left untreated and then cocultured with CD4+ T cells. (A) After 3 d, culture supernatants were assessed for IL-23, IL-1β, and IL-6. (B) The expression of HLA-DR, CD86, and PD-L1 on MDDCs or monocytes treated or not treated with HIV was also evaluated. P values were calculated using the paired t test. **P < 0.01. (C) Radar plots summarizing the differential responses of MDDCs vs. monocytes to HIV.
Figure 3.
Figure 3.. Th17 and Th1 responses in CD4+ T cell cultures with HIV-treated MDDCs or monocytes.
CD4+ T cells were cultured with HIV-treated allogeneic MDDCs or monocytes at a T cell/APC ratio of 5:1 for 13 d. Mock-treated cocultures from the same donors were maintained in parallel. After PMA and ionomycin treatment, the cells were stained and analyzed for the frequencies of IL-17+ cells and IFN-γ+ cells by flow cytometry. (A–B) CD4+ T cells were cultured with mock-treated or HIV-1 SF162-treated MDDCs (MOI = 0.5). (A) Dot plots from one representative subject showing IL-17 and IFN-γ expression in the CD4+ T cells. (B) Cumulative data showing the percentages of total IL-17+ and IFN-γ+ (left panel), single-positive IL-17+, and double-positive IL-17+IFN-γ+ CD4+ T cells (right panel) in the mock vs. HIV-treated MDDCs cocultures from multiple donors. (C–D) CD4+ T cells were cultured with mock-treated or HIV-1 SF162-treated monocytes (MOI = 0.5). (C) Dot plots from one representative subject showing IL-17 and IFN-γ expression in the CD4+ T cells. (D) The percentages of total IL-17+ and IFN-γ+ (left panel), single-positive IL-17+, and double-positive IL-17+IFN-γ+ CD4+ T cells (right panel) in the monocytes cocultures from different donors. (E–F) CD4+ T cells were infected with cell-free HIV-1 SF162 at MOI = 0.1 and cocultured with untreated monocytes. (E) Dot plots from one representative subject showing the expression of IL-17 and IFN-γ in the CD4+ T cells. (F) The percentages of total IL-17+ and IFN-γ+ (left panel), single-positive IL-17+ and double-positive IL-17+IFN-γ+ CD4+ T cells (right panel) in cultures from different donors. P values were calculated using the paired t test. *P < 0.05, **P < 0.01 (G) Fold-changes in the frequencies of total IL-17+ and IFN-γ+CD4+ T cells in the cocultures of CD4+ T cells with HIV-1-treated MDDCs or monocytes over those of mock-treated controls. Means ± se from all donors tested are shown.
Figure 4.
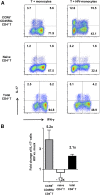
Figure 4.. IL-17 and IFN-γ responses induced in memory, naïve, and total CD4+ T cells cocultured with HIV-treated monocytes.
Memory CD45RA CCR6+ CD4+ T cells, naïve CD45RA+ CD4+ T cells, and total CD4+ T cells were cocultured with allogenic HIV-treated monocytes at a T/APC ratio of 5 to 1 for 13 d. At d 13, the cells were stained with anti-IL-17 and IFN-γ Abs after PMA and ionomycin treatment and analyzed by flow cytometry. (A) Dot plots from one representative subject showing IL-17 and IFN-γ expression in the memory (top panels), naïve (middle panels), and total CD4+ T cells (lower panels). (B) Fold-changes of the IL-17+ CD4+ T cell frequencies in the cocultures with HIV-1-treated monocytes over those of mock-treated controls. Means ± se from 2–3 different donors are shown.
Figure 5.
Figure 5.. HIV infection in the CD4+ T cells cocultured with virus-treated MDDCs or monocytes.
(A) Dot plots from one representative subject showing p24+ and IL-17+ (top) or IFN-γ+ (bottom) CD4+ T cells in the cultures with virus-treated or untreated allogeneic MDDCs. (B) Dot plots from one representative subject showing p24+ and IL-17+ (top) or IFN-γ+ (bottom) CD4+ T cells in the cocultures without virus or with virus-treated monocytes. For comparison, CD4+T cells were also infected with cell-free virus and then cocultured with monocytes. (C) The frequencies of total HIV-1-infected (p24+) CD4+ T cells in the different cocultures from multiple donors (n = 6). (D) The proportions of Th17 and Th1 cells infected with HIV (p24+) in the different cocultures from multiple donors (n = 3-6). P values were calculated using paired t test, *P < 0.05, **P < 0.01 or by unpaired t test, #P < 0.05.
Figure 6.
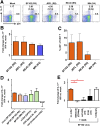
Figure 6.. Th17 responses in the CD4+ T cell cultures containing monocytes treated with different HIV-1 strains.
(A–C) CD4+ T cells were cocultured at a T cell/APC ratio of 5:1 with allogenic monocytes treated with SF162, JRFL, REJO, or MN viruses (MOI = 0.5). At d 13, the cells were stimulated with PMA and ionomycin, stained with anti–IL-17 and anti–IFN-γ Abs, and analyzed by flow cytometry. (A) Dot plots from one representative subject showing the expression of IL-17 and p24 in the CD4+ T cells. (B) Fold-changes in the percentages of IL-17+ cells in the cultures with virus-treated monocytes over those with mock-treated monocytes. (C) The frequencies of p24+CD4+ T cells in the cocultures with virus-treated monocytes. (D) Fold-changes in the frequencies of IL-17+ cells cultured with treated vs. untreated monocytes. Monocytes are treated with SF162 virus, viral gp120 proteins (SF162 and MN, 1 µg/ml), an anti-CD4 Ab (OKT4, 2 µg/ml), recombinant IL-16 (40 ng/ml), or an irrelevant Ab control (2 µg/ml). (E) Fold-changes in IL-17+ cell frequencies in the cultures with monocytes treated with virus ± Abs. SF162 virus was preincubated with mAbs against the CD4-binding site (NIH45-46), V3 (447-52D), V2 (2158) of the HIV envelope gp120 or with a control Ab (1418). Means ± se from at least 2 independent experiments are shown. P values were calculated using the paired t test. *P < 0.05.
Figure 7.
Figure 7.. Proliferation and apoptosis of CD4+ T cells cocultured with MDDCs or monocytes.
CD4+ T cells were labeled with CFSE, cocultured with MDDCs or monocytes that were pretreated with or without HIV, and analyzed for proliferation and apoptosis. (A and B) The proliferation of CD4+ T cells cocultured with virus-treated or untreated MDDCs vs. monocytes. (A) Representative data showing the proliferating CFSElo CD4+ T cells in the cocultures with MDDCs (left panel) vs. monocytes (right panel) with or without HIV. (B) The frequencies of CFSEloCD4+ T cells in the cocultures from different donors. (C) The expression of active caspase-3 in CD4+ T cells cocultured with HIV-treated and mock-treated MDDCs vs. monocytes. (Top left panel) A representative dot plot showing the gating of CD4lo and CD4hiCD3+ T cells. (Top right panel) A representative histogram to show the up-regulation of active caspase-3 in the CD4loCD3+ T cells cocultured with HIV-treated MDDCs but not in the CD4hi cells with HIV- or mock-treated MDDCs. No increase in active caspase-3 staining was detected in CD4lo or CD4hiCD3+ T cells in the cultures with HIV- and mock-treated monocytes. (Bottom panels) The percentages of active caspase-3+ cells among the CD4lo and CD4hi T cell populations in the cultures from different donors. P values were calculated using the paired t test. *P < 0.05, **P < 0.01.

Similar articles

Cited by

References

    1. Chun T. W., Chadwick K., Margolick J., Siliciano R. F. (1997) Differential susceptibility of naive and memory CD4+ T cells to the cytopathic effects of infection with human immunodeficiency virus type 1 strain LAI. J. Virol. 71, 4436–4444. - PMC - PubMed
    1. Dai J., Agosto L. M., Baytop C., Yu J. J., Pace M. J., Liszewski M. K., O’Doherty U. (2009) Human immunodeficiency virus integrates directly into naive resting CD4+ T cells but enters naive cells less efficiently than memory cells. J. Virol. 83, 4528–4537. - PMC - PubMed
    1. Lambotte O., Demoustier A., de Goër M. G., Wallon C., Gasnault J., Goujard C., Delfraissy J. F., Taoufik Y. (2002) Persistence of replication-competent HIV in both memory and naive CD4 T cell subsets in patients on prolonged and effective HAART. AIDS 16, 2151–2157. - PubMed
    1. Ostrowski M. A., Chun T. W., Justement S. J., Motola I., Spinelli M. A., Adelsberger J., Ehler L. A., Mizell S. B., Hallahan C. W., Fauci A. S. (1999) Both memory and CD45RA+/CD62L+ naive CD4+ T cells are infected in human immunodeficiency virus type 1-infected individuals. J. Virol. 73, 6430–6435. - PMC - PubMed
    1. Bacchus C., Cheret A., Avettand-Fenoël V., Nembot G., Mélard A., Blanc C., Lascoux-Combe C., Slama L., Allegre T., Allavena C., Yazdanpanah Y., Duvivier C., Katlama C., Goujard C., Seksik B. C., Leplatois A., Molina J. M., Meyer L., Autran B., Rouzioux C.; OPTIPRIM ANRS 147 study group (2013) A single HIV-1 cluster and a skewed immune homeostasis drive the early spread of HIV among resting CD4+ cell subsets within one month post-infection. PLoS One 8, e64219. - PMC - PubMed

Publication types

MeSH terms