. 2016 Sep 15;197(6):2250-60.
doi: 10.4049/jimmunol.1600492. Epub 2016 Aug 12.

Conditional Disruption of Raptor Reveals an Essential Role for mTORC1 in B Cell Development, Survival, and Metabolism

Affiliations

Conditional Disruption of Raptor Reveals an Essential Role for mTORC1 in B Cell Development, Survival, and Metabolism

Terri N Iwata et al. J Immunol. .

Abstract

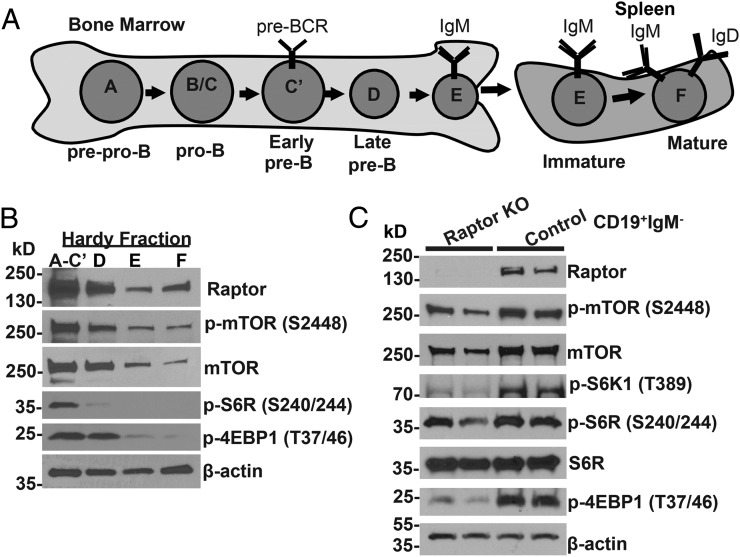
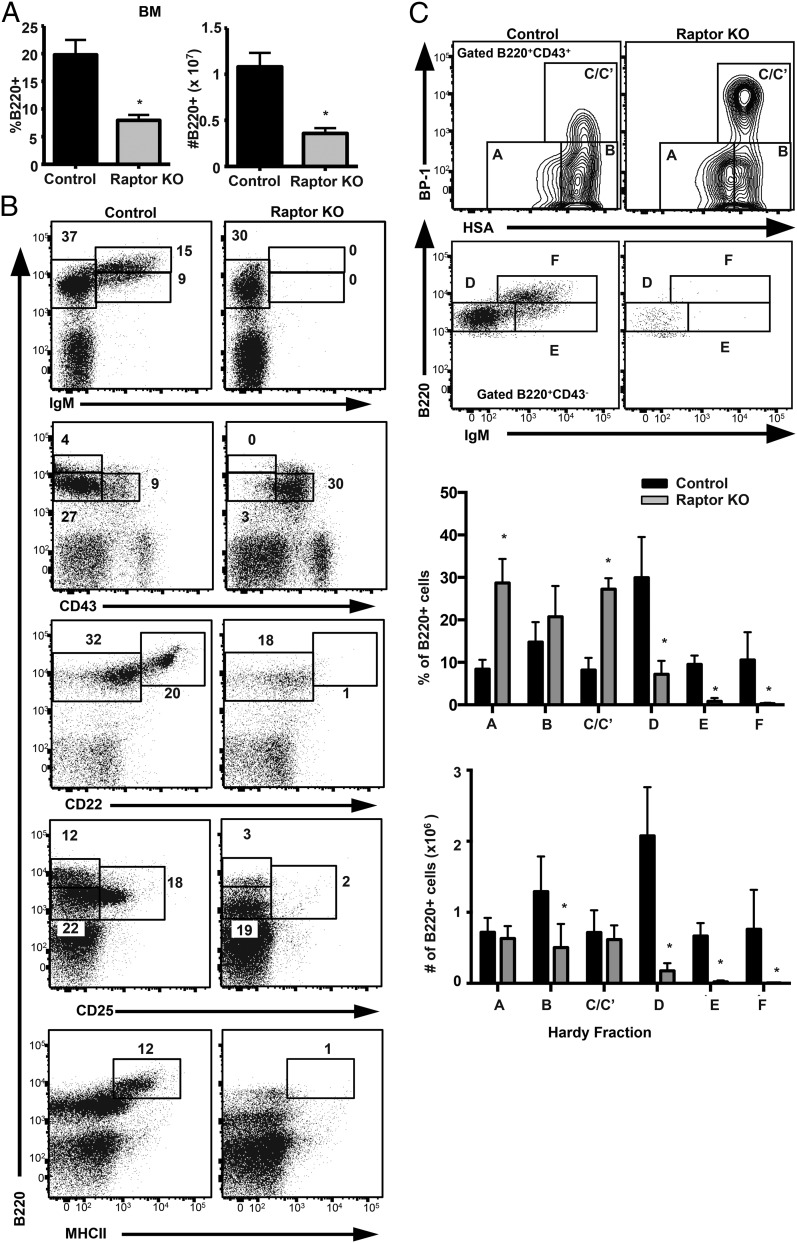
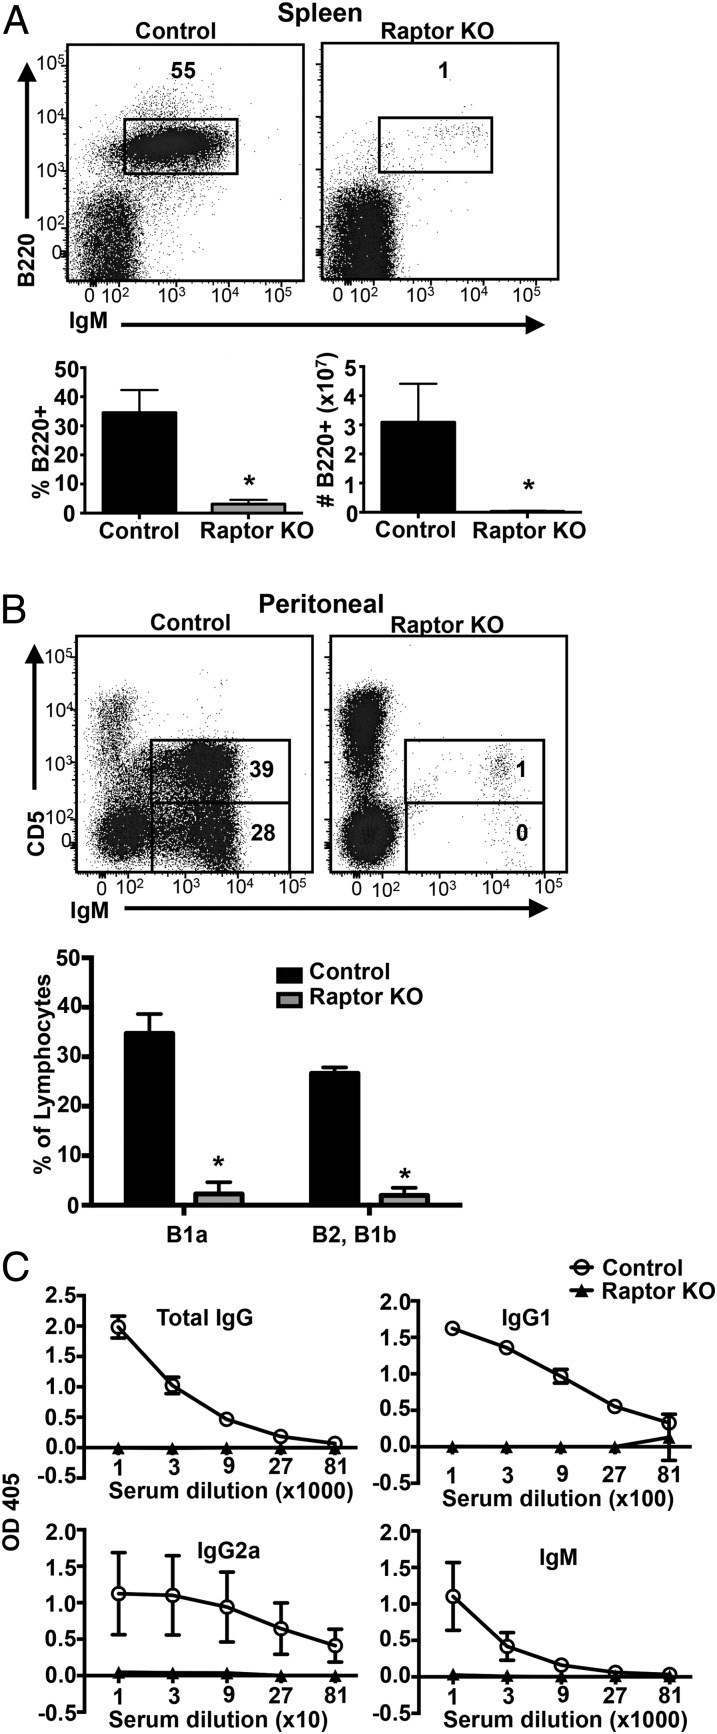
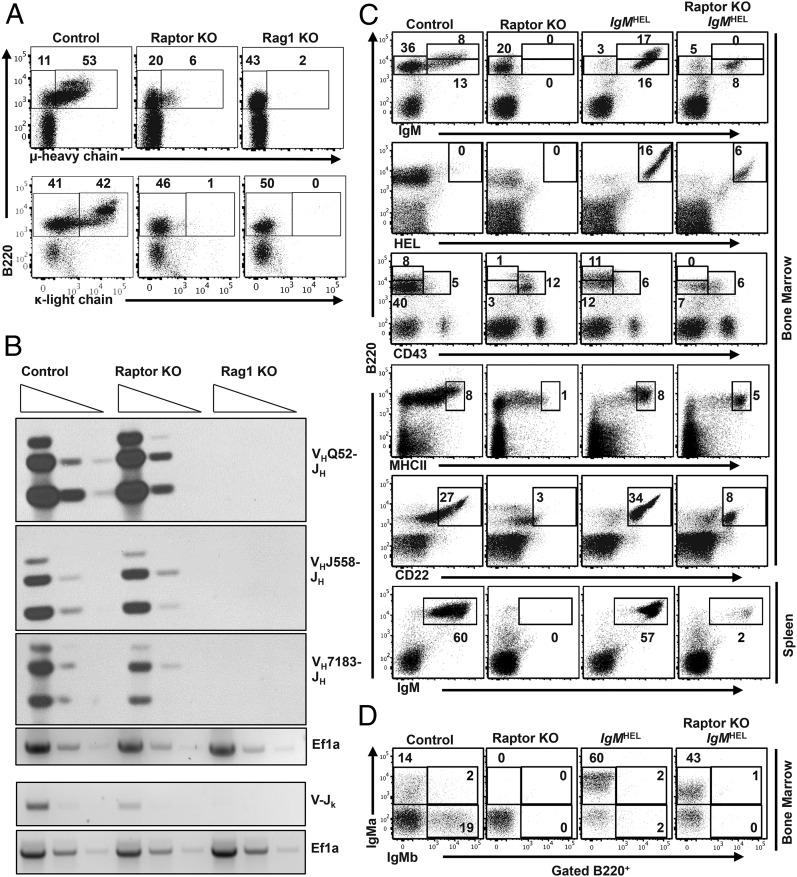
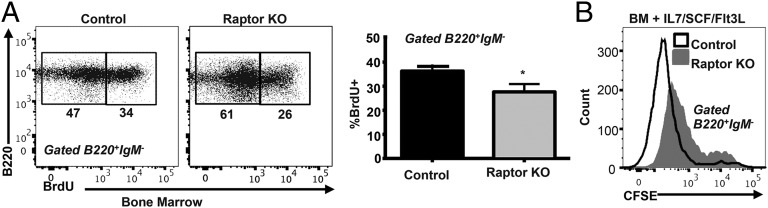
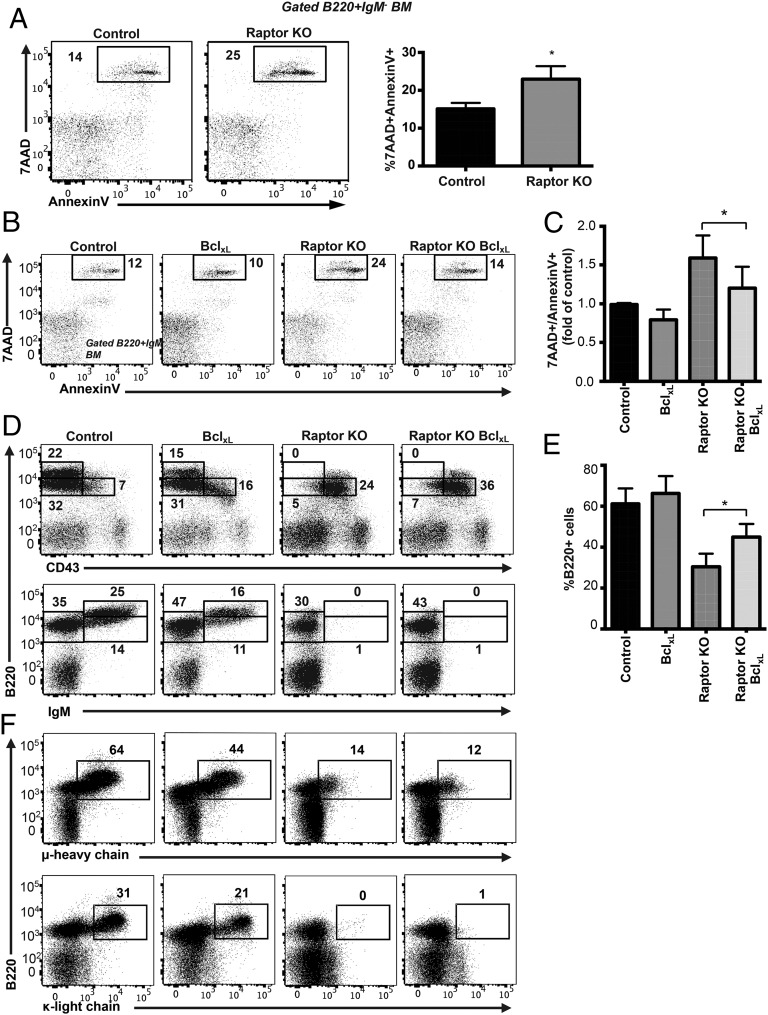
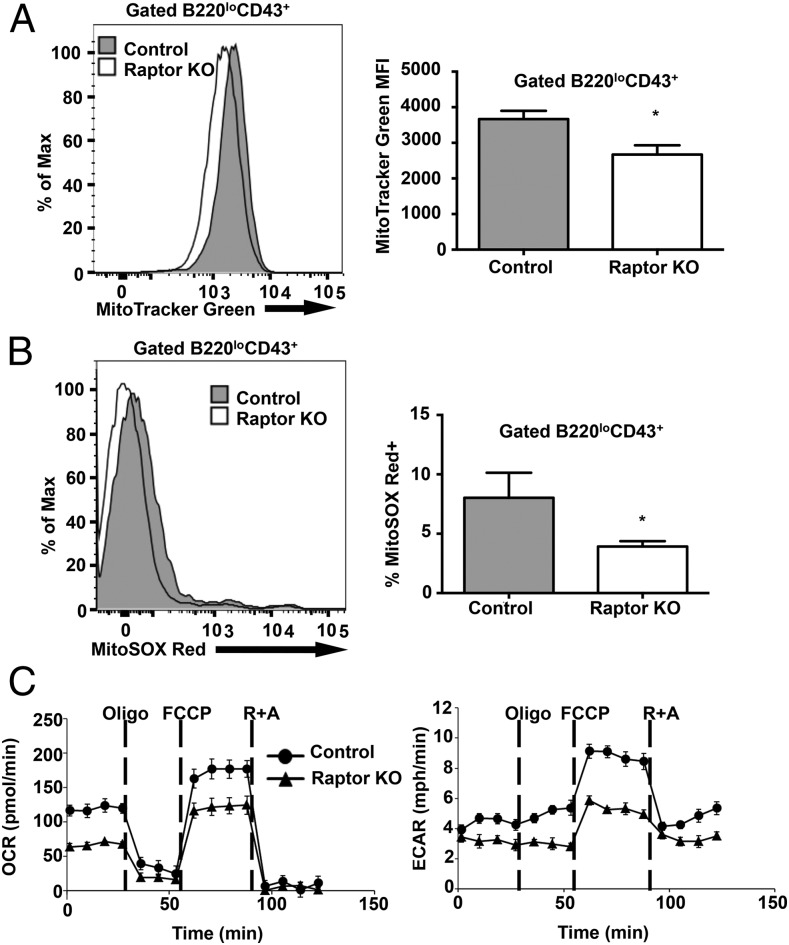
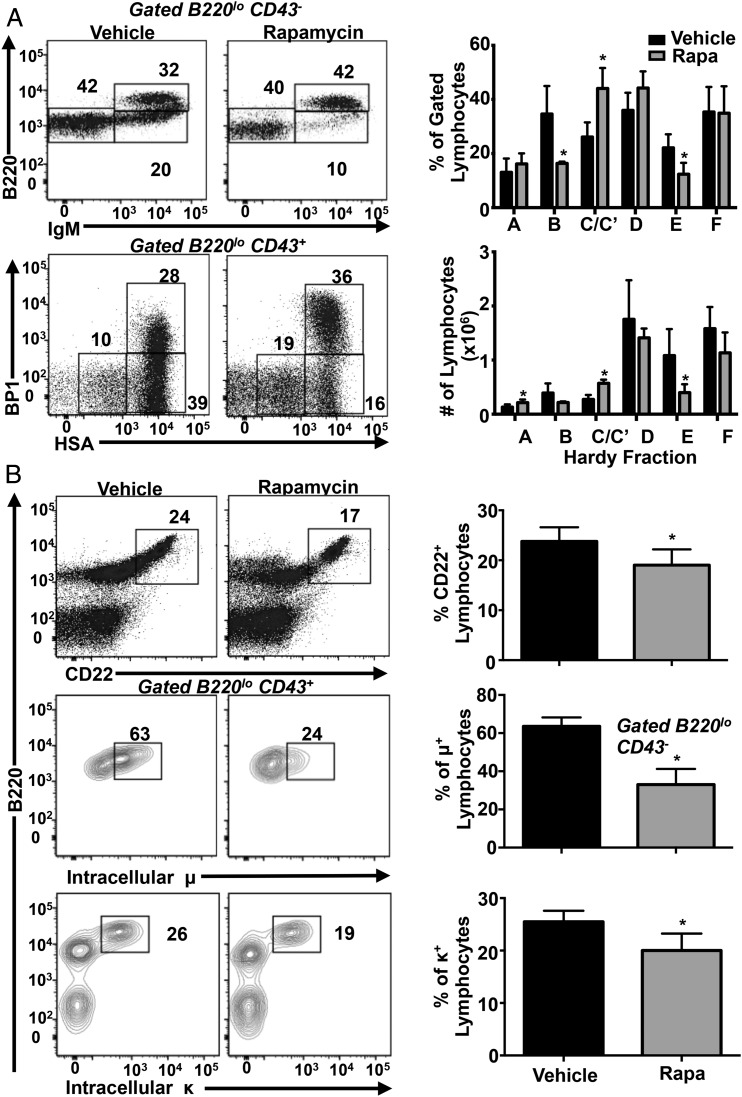
Mechanistic target of rapamycin (mTOR) is a serine-threonine kinase that coordinates nutrient and growth factor availability with cellular growth, division, and differentiation. Studies examining the roles of mTOR signaling in immune function revealed critical roles for mTOR in regulating T cell differentiation and function. However, few studies have investigated the roles of mTOR in early B cell development. In this study, we found that mTOR is highly activated during the pro- and pre-B stages of mouse B cell development. Conditional disruption of the mTOR coactivating protein Raptor in developing mouse B cells resulted in a developmental block at the pre-B cell stage, with a corresponding lack of peripheral B cells and loss of Ag-specific Ab production. Pre-B cell survival and proliferation were significantly reduced in Raptor-deficient mice. Forced expression of a transgenic BCR or a BclxL transgene on Raptor-deficient B cells failed to rescue B cell development, suggesting that pre-BCR signaling and B cell survival are impaired in a BclxL-independent manner. Raptor-deficient pre-B cells exhibited significant decreases in oxidative phosphorylation and glycolysis, indicating that loss of mTOR signaling in B cells significantly impairs cellular metabolic capacity. Treatment of mice with rapamycin, an allosteric inhibitor of mTOR, recapitulated the early B cell developmental block. Collectively, our data reveal a previously uncharacterized role for mTOR signaling in early B cell development, survival, and metabolism.


Figures

FIGURE 1.
FIGURE 1.
mTOR signaling is normally activated in early B cell development and is decreased in Raptor-deficient mice. (A) Diagram of mouse B cell developmental stages with Hardy fraction notations (9). (B) BM B cells corresponding to Hardy fractions A–C′ (B220+CD43+), D (B220+CD43IgM), E (B220loCD43IgM+), and F (B220hiCD43IgM+) were purified from six WT mice and pooled. Immunoblotting was performed using Abs with specificity for the indicated proteins. β-actin was used as a loading control. (C) CD19+IgM BM cells were isolated from two Raptor-null and two WT control mice. Immunoblotting was performed using Abs with specificity for the indicated proteins.
FIGURE 2.
FIGURE 2.
mTOR signaling is required for pre-B cell development. (A) BM cells from Raptor-null and WT control mice (n ≥ 5 mice per genotype) were analyzed by flow cytometry. The percentage (left panel) and number (right panel) of B220+ lymphocytes were calculated for each genotype. Data are mean ± SD and were calculated from two independent experiments. (B) BM cells from Raptor-null and WT control mice were stained with fluorescent-conjugated Abs and analyzed by flow cytometry. Shown are representative plots (n ≥ 6 mice per genotype) from three independent experiments. (C) BM cells from Raptor-null and WT control mice were stained with fluorescent-conjugated Abs and analyzed by flow cytometry. Shown are representative plots (n ≥ 6 mice per genotype) from three independent experiments. The percentage and number of B220+ lymphocytes in each Hardy fraction were calculated for each genotype. Data are mean ± SD pooled from three independent experiments. *p < 0.05.
FIGURE 3.
FIGURE 3.
Raptor-deficient mice lack peripheral B cells and exhibit impaired Ab production. Splenocytes (A) and peritoneal cells (B) from Raptor-null and WT control mice were stained with fluorescent-conjugated Abs and analyzed by flow cytometry. Percentage and number of B220+ cells were calculated for each genotype. Data are mean ± SD (n ≥ 5 mice per genotype) pooled from three independent experiments. (C) Raptor-null (n = 5) and control (n = 5) mice were immunized with KLH Ag. Sera were collected 4 wk postimmunization and analyzed by ELISA for the indicated KLH-specific Igs. *p < 0.05.
FIGURE 4.
FIGURE 4.
Expression of Ig H and L chains are impaired in Raptor-deficient B cells, and enforced expression of IgMHEL transgene does not restore normal development. (A) BM cells from Raptor-null and WT control mice were stained with anti-B220 and anti-IC Igμ or Igκ Abs. Rag1-null mice were used as a control for loss of μ and κ expression. Data are representative of three independent experiments (n ≥ 5 mice per genotype). (B) DNA was isolated from CD19+IgM pro- and pre-B cells from mice of the indicated genotypes. DNA was serially diluted, and PCR was used to amplify rearranged IgH and IgL genes. The EF1a gene was used as a loading control. Data shown are representative of two independent experiments. (C and D) BM and splenocytes from WT control, Raptorfl/flMb1-Cre, IgMHEL, and Raptorfl/flMb1-Cre IgMHEL mice were stained with the indicated Abs and analyzed by flow cytometry. Shown are representative plots (n = 4 mice per genotype) from two independent experiments.
FIGURE 5.
FIGURE 5.
Raptor-deficient B cells exhibit decreased proliferation. (A) Raptor-null and WT control mice were injected with BrdU. BM was collected 16 h later, stained with fluorescent-conjugated cell surface markers against B220 and IgM, fixed, permeabilized, and stained with anti-BrdU Ab. Data are mean ± SD (n ≥ 4 mice per genotype) pooled from two independent experiments. (B) BM cells from Raptor-null and WT control mice were labeled with CFSE and cultured for 4 d in media containing IL-7/SCF/Flt3L cytokines. B220+IgM cells were analyzed for CFSE dilution. Data shown (n = 3 mice per genotype) are representative of two independent experiments. *p < 0.05.
FIGURE 6.
FIGURE 6.
Inhibiting apoptosis does not rescue B cell development of Raptor-deficient B cells. (A) BM cells and splenocytes from Raptor-null and WT control mice were stained with Annexin V and 7-AAD to assess cell death and analyzed by flow cytometry. Data are mean ± SD (n ≥ 4–6 mice per genotype) calculated from two independent experiments. (B and C) BM cells from mice of the indicated genotypes were stained with Annexin V and 7-AAD to assess cell death and analyzed by flow cytometry. Data are mean ± SD (n ≥ 5 mice per genotype) and are representative of at least four independent experiments. (D and E) BM cells from mice of the indicated genotypes were stained with fluorescent-conjugated Abs and analyzed by flow cytometry. Data are mean ± SD (n ≥ 5 mice per genotype) from at least two independent experiments. (F) BM cells from mice of the indicated genotypes were stained with anti-B220 and anti-IC Igμ or Igκ Abs. Data are representative of at least two independent experiments (n ≥ 5 mice per genotype). *p < 0.05.
FIGURE 7.
FIGURE 7.
Raptor-deficient B cells display altered metabolism. (A) BM cells from WT control and Raptor-null mice were stained with MitoTracker Green FM to analyze mitochondrial membrane potential. Data are mean ± SD (n ≥ 3 mice per enotype) and are representative of two independent experiments. (B) BM cells from WT control and Raptor-null mice were stained with MitoSOX Red to analyze mitochondrial reactive oxygen species. Data are mean ± SD (n ≥ 5 mice per genotype) pooled from two independent experiments. (C) CD19+IgM B cells were isolated from BM of Raptor and WT control mice. OCR and ECAR were analyzed with a Seahorse Bioscience extracellular flux analyzer. Cells were cultured in the presence of IL-7 (10 ng/ml) for 24 h prior to analysis. Oligomycin (Oligo), FCCP, and rotenone and antimycin A (R+A) were added to the culture at the indicated time points. Data are mean ± SD (n = 3 mice per genotype) and are representative of two independent experiments. *p < 0.05.
FIGURE 8.
FIGURE 8.
Rapamycin inhibits B cell development in vivo. (A) and (B) WT C57BL/6 mice were injected i.p. daily for 3 wk with vehicle or 8 mg/kg rapamycin (n = 5 mice per treatment). BM cells were stained with the indicated Abs and analyzed by flow cytometry. Representative dot plots are shown. Bar graphs show mean ± SD. *p < 0.05.

Similar articles

Cited by

References

    1. Laplante M., Sabatini D. M. 2012. mTOR signaling in growth control and disease. Cell 149: 274–293. - PMC - PubMed
    1. Shimobayashi M., Hall M. N. 2014. Making new contacts: the mTOR network in metabolism and signalling crosstalk. Nat. Rev. Mol. Cell Biol. 15: 155–162. - PubMed
    1. Abraham R. T., Wiederrecht G. J. 1996. Immunopharmacology of rapamycin. Annu. Rev. Immunol. 14: 483–510. - PubMed
    1. Powell J. D., Pollizzi K. N., Heikamp E. B., Horton M. R. 2012. Regulation of immune responses by mTOR. Annu. Rev. Immunol. 30: 39–68. - PMC - PubMed
    1. Liu C., Chapman N. M., Karmaus P. W. F., Zeng H., Chi H. 2015. mTOR and metabolic regulation of conventional and regulatory T cells. J. Leukoc. Biol. 97: 837–847. - PMC - PubMed

MeSH terms