

The human olfactory transcriptome
- PMID: 27515280
- PMCID: PMC4982115
- DOI: 10.1186/s12864-016-2960-3
The human olfactory transcriptome
Abstract
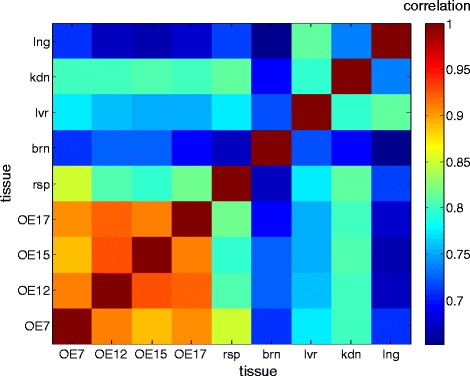
Background: Olfaction is a versatile sensory mechanism for detecting thousands of volatile odorants. Although molecular basis of odorant signaling is relatively well understood considerable gaps remain in the complete charting of all relevant gene products. To address this challenge, we applied RNAseq to four well-characterized human olfactory epithelial samples and compared the results to novel and published mouse olfactory epithelium as well as 16 human control tissues.
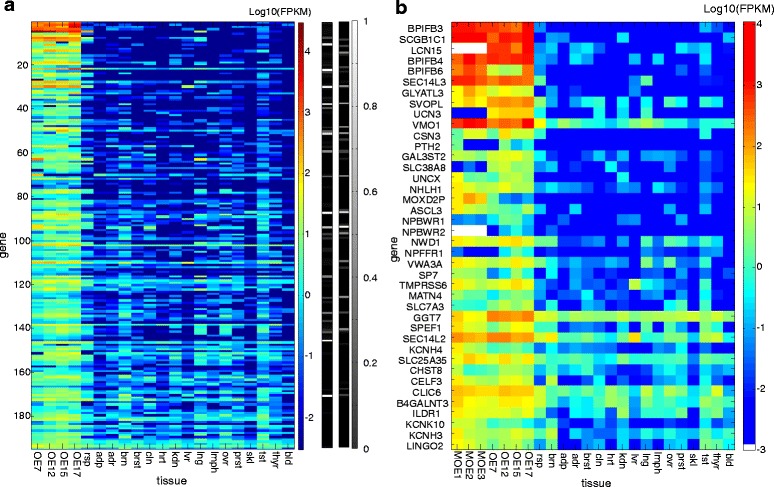
Results: We identified 194 non-olfactory receptor (OR) genes that are overexpressed in human olfactory tissues vs.
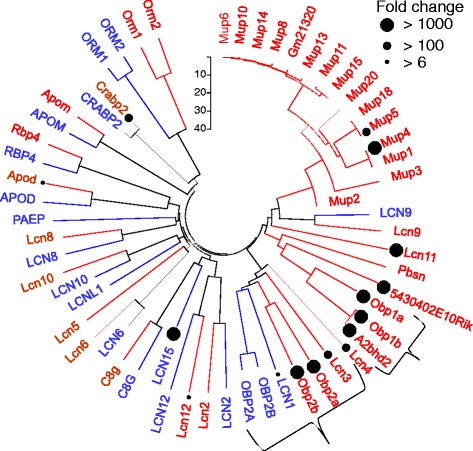
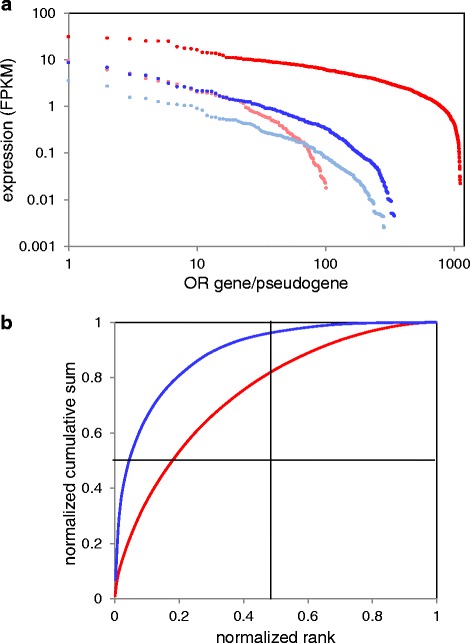
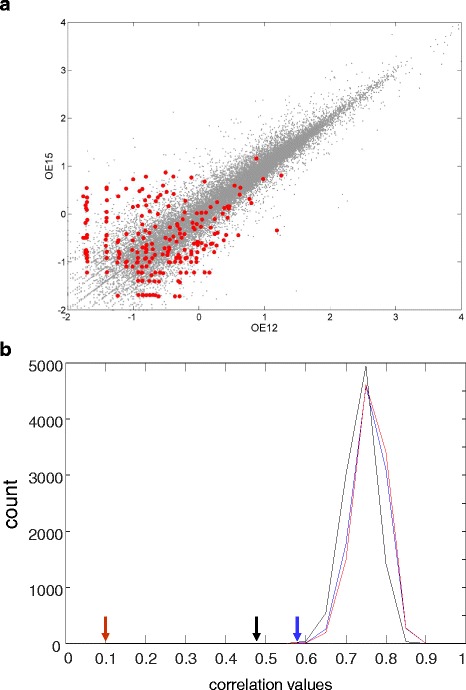
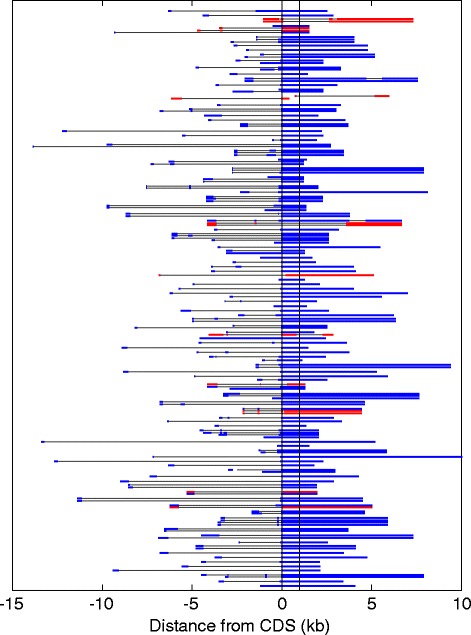
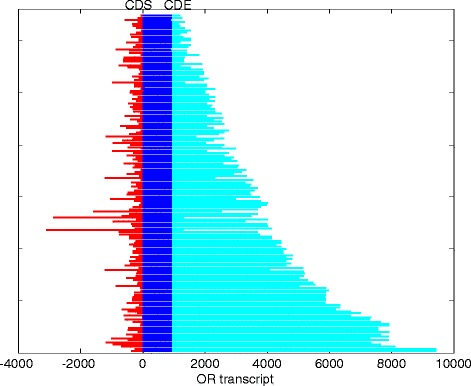
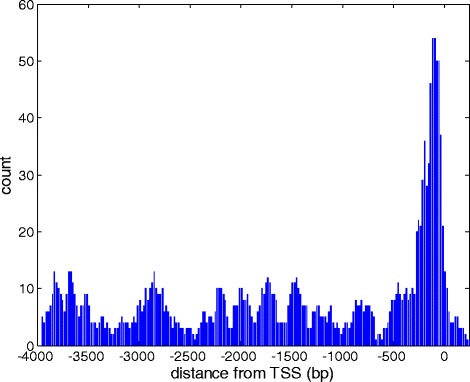
Controls: The highest overexpression is seen for lipocalins and bactericidal/permeability-increasing (BPI)-fold proteins, which in other species include secreted odorant carriers. Mouse-human discordance in orthologous lipocalin expression suggests different mammalian evolutionary paths in this family. Of the overexpressed genes 36 have documented olfactory function while for 158 there is little or no previous such functional evidence. The latter group includes GPCRs, neuropeptides, solute carriers, transcription factors and biotransformation enzymes. Many of them may be indirectly implicated in sensory function, and ~70 % are over expressed also in mouse olfactory epithelium, corroborating their olfactory role. Nearly 90 % of the intact OR repertoire, and ~60 % of the OR pseudogenes are expressed in the olfactory epithelium, with the latter showing a 3-fold lower expression. ORs transcription levels show a 1000-fold inter-paralog variation, as well as significant inter-individual differences. We assembled 160 transcripts representing 100 intact OR genes. These include 1-4 short 5' non-coding exons with considerable alternative splicing and long last exons that contain the coding region and 3' untranslated region of highly variable length. Notably, we identified 10 ORs with an intact open reading frame but with seemingly non-functional transcripts, suggesting a yet unreported OR pseudogenization mechanism. Analysis of the OR upstream regions indicated an enrichment of the homeobox family transcription factor binding sites and a consensus localization of a specific transcription factor binding site subfamily (Olf/EBF).
Conclusions: We provide an overview of expression levels of ORs and auxiliary genes in human olfactory epithelium. This forms a transcriptomic view of the entire OR repertoire, and reveals a large number of over-expressed uncharacterized human non-receptor genes, providing a platform for future discovery.
Keywords: Olfaction; Olfactory epithelium; Olfactory receptor; RNAseq.
Figures

Similar articles
-
Expression profile of ectopic olfactory receptors determined by deep sequencing.PLoS One. 2013;8(2):e55368. doi: 10.1371/journal.pone.0055368. Epub 2013 Feb 6. PLoS One. 2013. PMID: 23405139 Free PMC article.
-
Odorant receptor expressed sequence tags demonstrate olfactory expression of over 400 genes, extensive alternate splicing and unequal expression levels.Genome Biol. 2003;4(11):R71. doi: 10.1186/gb-2003-4-11-r71. Epub 2003 Oct 7. Genome Biol. 2003. PMID: 14611657 Free PMC article.
-
Engineering Aspects of Olfaction.In: Persaud KC, Marco S, Gutiérrez-Gálvez A, editors. Neuromorphic Olfaction. Boca Raton (FL): CRC Press/Taylor & Francis; 2013. Chapter 1. In: Persaud KC, Marco S, Gutiérrez-Gálvez A, editors. Neuromorphic Olfaction. Boca Raton (FL): CRC Press/Taylor & Francis; 2013. Chapter 1. PMID: 26042329 Free Books & Documents. Review.
-
Widespread ectopic expression of olfactory receptor genes.BMC Genomics. 2006 May 22;7:121. doi: 10.1186/1471-2164-7-121. BMC Genomics. 2006. PMID: 16716209 Free PMC article.
-
Odorant receptor diversity and patterned gene expression in the mammalian olfactory epithelium.Prog Clin Biol Res. 1994;390:75-84. Prog Clin Biol Res. 1994. PMID: 7724652 Review.
Cited by
-
The human olfactory cleft mucus proteome and its age-related changes.Sci Rep. 2018 Nov 21;8(1):17170. doi: 10.1038/s41598-018-35102-2. Sci Rep. 2018. PMID: 30464187 Free PMC article.
-
Lipocalin 15 in the olfactory mucus is a biomarker for Bowman's gland activity.Sci Rep. 2022 Jun 24;12(1):9984. doi: 10.1038/s41598-022-13464-y. Sci Rep. 2022. PMID: 35750866 Free PMC article.
-
Shedding light on human olfaction: Electrophysiological recordings from sensory neurons in acute slices of olfactory epithelium.iScience. 2023 Jun 21;26(7):107186. doi: 10.1016/j.isci.2023.107186. eCollection 2023 Jul 21. iScience. 2023. PMID: 37456832 Free PMC article.
-
Genetic variation across the human olfactory receptor repertoire alters odor perception.Proc Natl Acad Sci U S A. 2019 May 7;116(19):9475-9480. doi: 10.1073/pnas.1804106115. Epub 2019 Apr 30. Proc Natl Acad Sci U S A. 2019. PMID: 31040214 Free PMC article.
-
Nasally inhaled therapeutics and vaccination for COVID-19: Developments and challenges.MedComm (2020). 2021 Dec 14;2(4):569-586. doi: 10.1002/mco2.101. eCollection 2021 Dec. MedComm (2020). 2021. PMID: 34977869 Free PMC article. Review.
References
MeSH terms
Substances
Grants and funding
LinkOut - more resources
Full Text Sources
Other Literature Sources
Molecular Biology Databases
Research Materials
Miscellaneous
