. 2016 Sep 29;90(20):9394-405.
doi: 10.1128/JVI.01471-16. Print 2016 Oct 15.

Graf1 Controls the Growth of Human Parainfluenza Virus Type 2 through Inactivation of RhoA Signaling

Affiliations

Graf1 Controls the Growth of Human Parainfluenza Virus Type 2 through Inactivation of RhoA Signaling

Keisuke Ohta et al. J Virol. .

Abstract

Rho GTPases are involved in a variety of cellular activities and are regulated by guanine nucleotide exchange factors and GTPase-activating proteins (GAPs). We found that the activation of Rho GTPases by lysophosphatidic acid promotes the growth of human parainfluenza virus type 2 (hPIV-2). Furthermore, hPIV-2 infection causes activation of RhoA, a Rho GTPase. We hypothesized that Graf1 (also known as ARHGAP26), a GAP, regulates hPIV-2 growth by controlling RhoA signaling. Immunofluorescence analysis showed that hPIV-2 infection altered Graf1 localization from a homogenous distribution within the cytoplasm to granules. Graf1 colocalized with hPIV-2 P, NP, and L proteins. Graf1 interacts with P and V proteins via their N-terminal common region, and the C-terminal Src homology 3 domain-containing region of Graf1 is important for these interactions. In HEK293 cells constitutively expressing Graf1, hPIV-2 growth was inhibited, and RhoA activation was not observed during hPIV-2 infection. In contrast, Graf1 knockdown restored hPIV-2 growth and RhoA activation. Overexpression of hPIV-2 P and V proteins enhanced hPIV-2-induced RhoA activation. These results collectively suggested that hPIV-2 P and V proteins enhanced hPIV-2 growth by binding to Graf1 and that Graf1 inhibits hPIV-2 growth through RhoA inactivation.

Importance: Robust growth of hPIV-2 requires Rho activation. hPIV-2 infection causes RhoA activation, which is suppressed by Graf1. Graf1 colocalizes with viral RNP (vRNP) in hPIV-2-infected cells. We found that Graf1 interacts with hPIV-2 P and V proteins. We also identified regions in these proteins which are important for this interaction. hPIV-2 P and V proteins enhanced the hPIV-2 growth via binding to Graf1, while Graf1 inhibited hPIV-2 growth through RhoA inactivation.


Figures

FIG 1
FIG 1
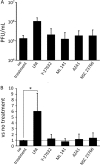
Effects of Rho activator/inhibitors on hPIV-2 growth. (A) HEK293 cells were incubated with or without 50 μM LPA, 20 μM Y-27632, 10 μM ML141, 2 μM AZA1, or 100 μM NSC23766. After treatment for 16 h, cells were infected with hPIV-2 at an MOI of 1. At 48 hpi, titers were measured by plaque assay as described in Materials and Methods. PFU counts are presented as the means from three independent experiments; error bars indicate standard deviations. (B) The results shown in panel A are represented as the ratios of the titers of virus from LPA-, Y-27632-, ML141-, AZA1-, or NSC23766-treated cells to those from untreated cells. The dotted line indicates the reagent-treated/untreated ratio of 1. *, P < 0.05. Error bars indicate standard deviations.
FIG 2
FIG 2
Activation of RhoA in hPIV-2-infected HEK293 cells. (A) HEK293 cells were infected with hPIV-2 at an MOI of 1 for the indicated times. Cell lysates were subjected to IB analysis using the indicated Abs. Actin was used as a loading control. For quantification of activated RhoA, lysates were reacted with rhotekin beads and subjected to IB analysis using anti-RhoA as described in Materials and Methods. These experiments were performed at least three times independently. (B) The results of quantitative densitometry of activated RhoA analyzed using ImageJ software (http://rsb.info.nih.gov/ij) are shown. The relative value in the mock infection at each time point equals 1. Error bars indicate standard deviations.
FIG 3
FIG 3
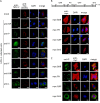
Subcellular localization of hPIV-2 proteins and myc-tagged Graf1 in hPIV-2-infected HeLa cells. (A) Cells were transfected with plasmid encoding Graf1, followed by mock (top row) or hPIV-2 infection, as indicated. At 48 hpi, cells were fixed, permeabilized, and stained with polyclonal anti-myc (red) and monoclonal anti-NP, anti-P, anti-V, anti-M, anti-F, anti-HN, or anti-L (green) Abs. Nuclei were stained with 4′,6′-diamidino-2-phenylindole (DAPI; blue). (B) The schematic shows the Graf1 domain structure consisting of an N-terminal Bin/amphiphysin/Rvs (BAR) domain, a pleckstrin homology (PH) domain, a RhoGAP (GAP) domain, and a C-terminal Src homology 3 (SH3) domain. Cells were transfected with plasmid encoding each domain of Graf1. Procedures of fixation, permeabilization, and staining with anti-myc Ab and DAPI were as described in panel A. (C) Cells were transfected with plasmid encoding each domain of Graf1 followed by hPIV-2 infection. Procedures of fixation, permeabilization, and staining with indicated Abs and DAPI were as described in panel A. Scale bar, 10 μm.
FIG 4
FIG 4
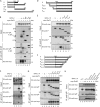
Interactions between Graf1 and hPIV-2 NP, P, V, L proteins and their mutants. (A) Schematic diagram of hPIV-2 V, P, and NP proteins. The N-terminal 164 aa of hPIV-2 V and P proteins are common (diagonally striped bars). (B) COS cells in a 12-well plate were transfected with various combinations of the indicated plasmids (total amounts of 0.5 μg/well). At 48 hpt, the cell extracts were analyzed directly by IB (polyclonal anti-myc and anti-V/P, -P, and -NP, as indicated). Immunoprecipitates with anti-V/P, -P, and -NP were probed by anti-V, -P, and -NP or polyclonal anti-myc. Double and single asterisks indicate immunoglobulin heavy chain and light chain, respectively. (C) BSR T7/5 cells in a six-well plate were transfected with the indicated plasmids (total amounts of 1.2 μg/well). IB and IP analyses were carried out as described for panel B using the indicated Abs. (D) Schematic diagram of hPIV-2 P protein and its N-terminally truncated mutants. (E) IB and IP analyses were carried out under the same conditions as those described for panel B. Anti-P was used for IB and the detection of P and its mutants. (F) Schematic diagram of hPIV-2 P protein and its C-terminally truncated mutants. (G) IB and IP analyses were carried out under the same conditions as those described for panel B. Anti-V/P was used for IB and the detection of P and its mutants. (H) IB and IP analyses were carried out under the same conditions as those described for panel B. Anti-V/P was used for IB and the detection of V and its mutants. All experiments were performed at least three times independently.
FIG 5
FIG 5
Interactions of hPIV-2 P or V proteins with Graf1 and its mutants. (A) Schematic diagram of full-length (FL) Graf1 and its deletion mutants with the N-terminal myc tag. Missing regions are indicated by the dotted lines. (B and C) COS cells were transfected with the indicated plasmids as described in the legend of Fig. 4B. At 48 hpt, the cell extracts were analyzed directly by IB analysis (anti-V/P and monoclonal anti-myc, as indicated). Immunoprecipitates with monoclonal anti-myc were probed by monoclonal anti-myc or anti-V/P, as indicated. myc-GFP was used to check the nonspecific interaction between the myc tag and V protein. Double and single asterisks indicate immunoglobulin heavy chain and light chain, respectively. All experiments were performed at least three times independently.
FIG 6
FIG 6
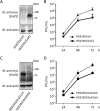
Effects of Graf1 on hPIV-2 growth. (A) The cell lysates of HEK293 cells constitutively expressing Graf1 (HEK293/Graf1) and their control cells (HEK293/ctrl) were subjected to IB analysis using anti-myc polyclonal Ab. Actin was measured as a loading control. (B) HEK293/Graf1 and HEK293/ctrl cells were infected with hPIV-2 at an MOI of 0.01 for the indicated times, and titers were measured by plaque assay as described in Materials and Methods. PFU counts of HEK293/Graf1 and HEK293/ctrl cells are presented as the means from three independent experiments. *, P < 0.05, compared to values in control cells. Error bars indicate standard deviations. (C) Cell lysates from Graf1-knocked down HEK293/Graf1 cells (HEK293/Graf1KD) and their control cells (HEK293/Graf1ctrl) were subjected to IB analysis as described for panel A. (D) HEK293/Graf1KD and HEK293/Graf1ctrl cells were infected with hPIV-2 under the same conditions as those described for panel B. PFU counts in HEK293/Graf1KD and HEK293/Graf1ctrl cells are shown.
FIG 7
FIG 7
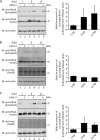
Effects of Graf1 on RhoA activation caused by hPIV-2 infection. hPIV-2 was inoculated into HEK293/ctrl (A), HEK293/Graf1 (B), or HEK293/Graf1KD (C) cells under the same conditions as those described in the legend of Fig. 2A. IB analysis and detection of activated RhoA were carried out as described in the legend of Fig. 2A. Bars show quantitative densitometry of activated RhoA analyzed as described in the legend of Fig. 2B.
FIG 8
FIG 8
Roles of hPIV-2 V and P proteins in RhoA activation induced by hPIV-2 infection. (A) Cell lysates of HEK293, HEK293/V, and HEK293/P cells were subjected to IB analysis using the indicated Abs for the quantification of activated RhoA, total RhoA, and actin as described in the legend of Fig. 2A. (B) Quantitative densitometry of activated RhoA from the experiment shown in panel A was performed as described in the legend of Fig. 2B. The relative value in normal HEK293 cells was set to 1. (C) Cell lysates of normal HEK293, HEK293/V, or HEK293/P cells infected with hPIV-2 at an MOI of 1 for 24 h were subjected to IB analysis using the indicated Abs. (D to F) hPIV-2 was inoculated into normal HEK293 (D), HEK293/V (E), or HEK293/P (F) cells at an MOI of 1 for the indicated times. IB analysis and detection of activated RhoA were carried out as described in the legend of Fig. 2A. Bars show quantitative densitometry of activated RhoA analyzed as described in the legend of Fig. 2B.
FIG 9
FIG 9
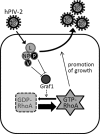
Models for the inhibition of Graf1 by hPIV-2 P and V proteins. During hPIV-2 infection, P and V proteins interact with Graf1 and block its GAP activity for RhoA, resulting in the increase of activated RhoA. Enhancement of RhoA activation promotes a step(s) in the hPIV-2 life cycle, leading to more effective growth of hPIV-2.

Similar articles

Cited by

References

    1. Hall A. 1998. Rho GTPases and the actin cytoskeleton. Science 279:509–514. doi:10.1126/science.279.5350.509. - DOI - PubMed
    1. Ridley AJ. 2006. Rho GTPases and actin dynamics in membrane protrusions and vesicle trafficking. Trends Cell Biol 16:522–529. doi:10.1016/j.tcb.2006.08.006. - DOI - PubMed
    1. Narumiya S. 1996. The small GTPase Rho: cellular functions and signal transduction. J Biochem 120:215–228. doi:10.1093/oxfordjournals.jbchem.a021401. - DOI - PubMed
    1. Harris KP, Tepass U. 2010. Cdc42 and vesicle trafficking in polarized cells. Traffic 11:1272–1279. doi:10.1111/j.1600-0854.2010.01102.x. - DOI - PubMed
    1. Melendez J, Grogg M, Zheng Y. 2011. Signaling role of Cdc42 in regulating mammalian physiology. J Biol Chem 286:2375–2381. doi:10.1074/jbc.R110.200329. - DOI - PMC - PubMed

Substances

LinkOut - more resources