. 2016 Sep 29;90(20):9364-82.
doi: 10.1128/JVI.01211-16. Print 2016 Oct 15.

Influenza A Virus Infection in Pigs Attracts Multifunctional and Cross-Reactive T Cells to the Lung

Affiliations

Influenza A Virus Infection in Pigs Attracts Multifunctional and Cross-Reactive T Cells to the Lung

Stephanie C Talker et al. J Virol. .

Abstract

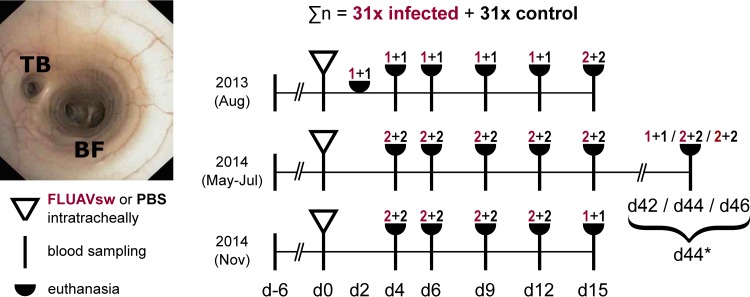
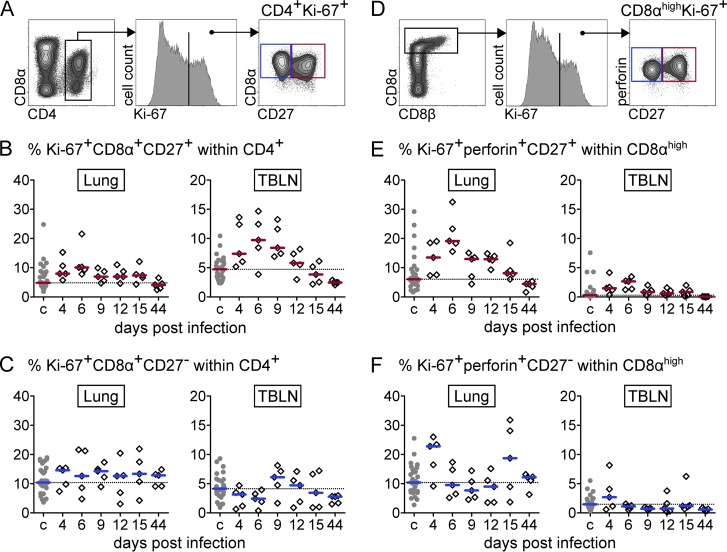
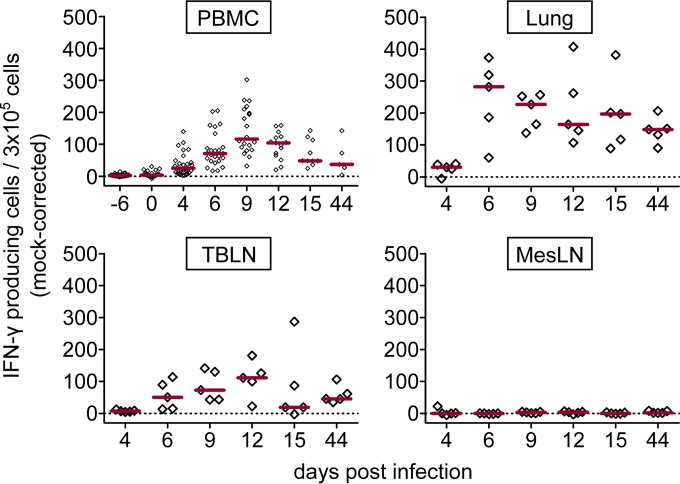
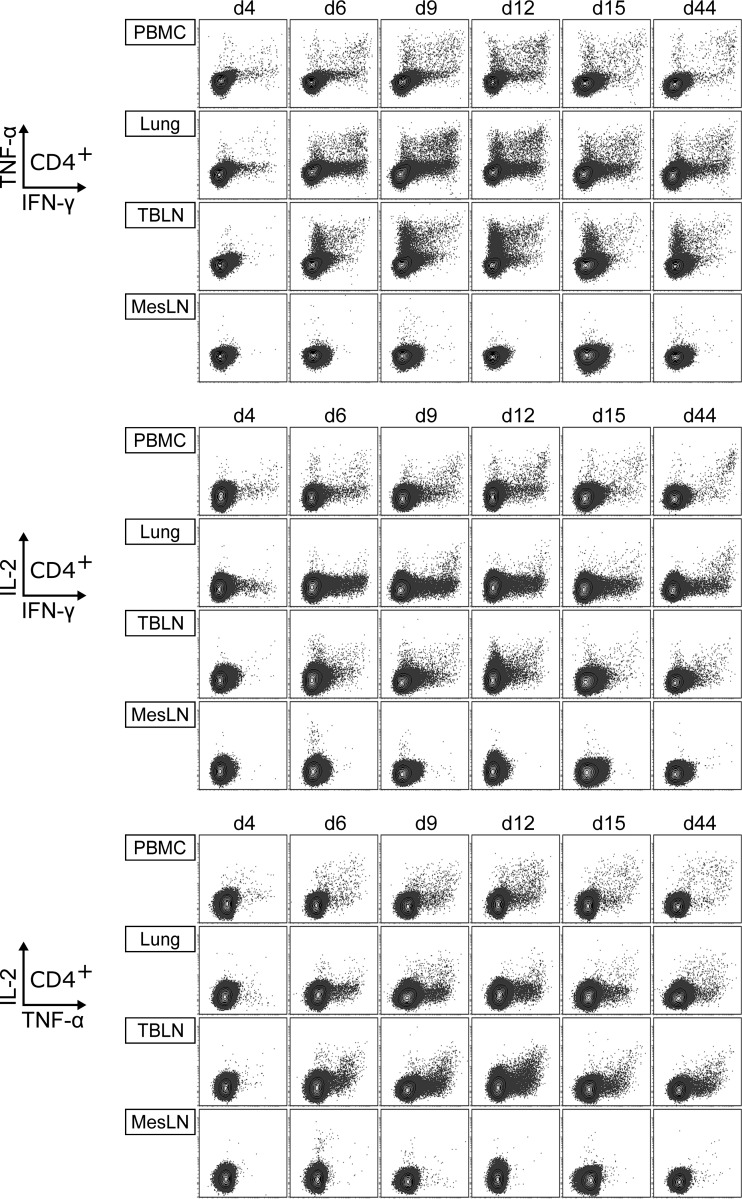
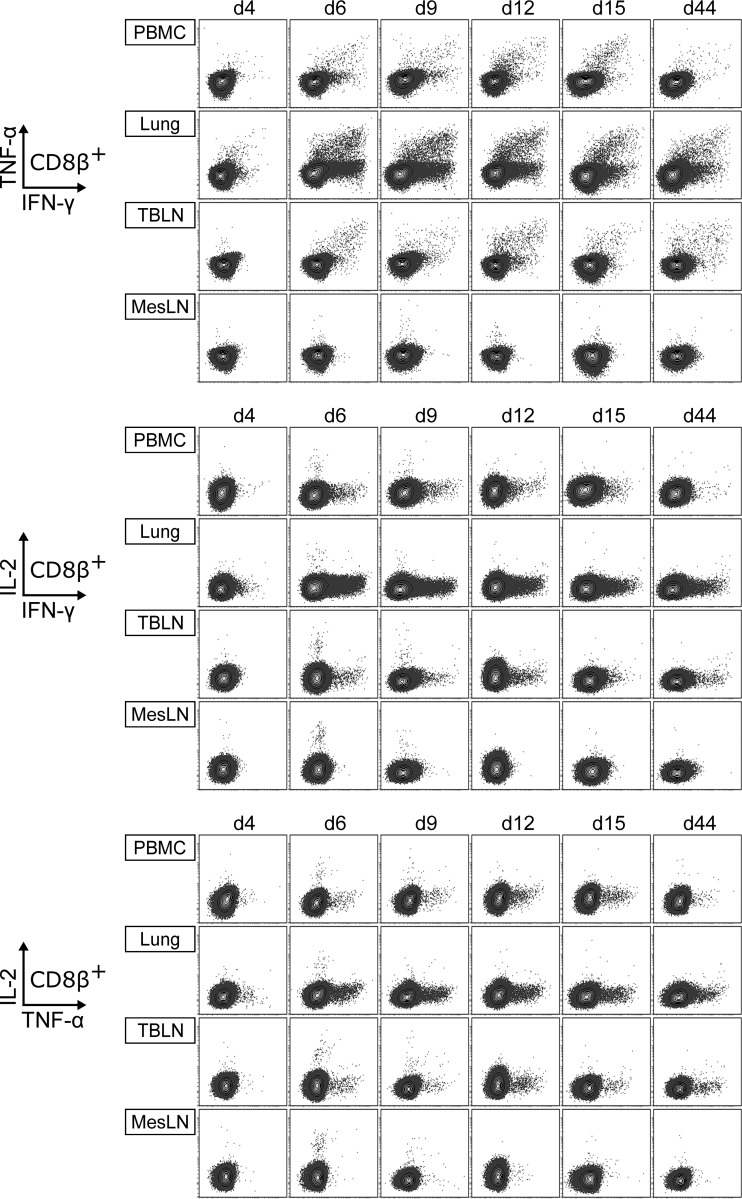
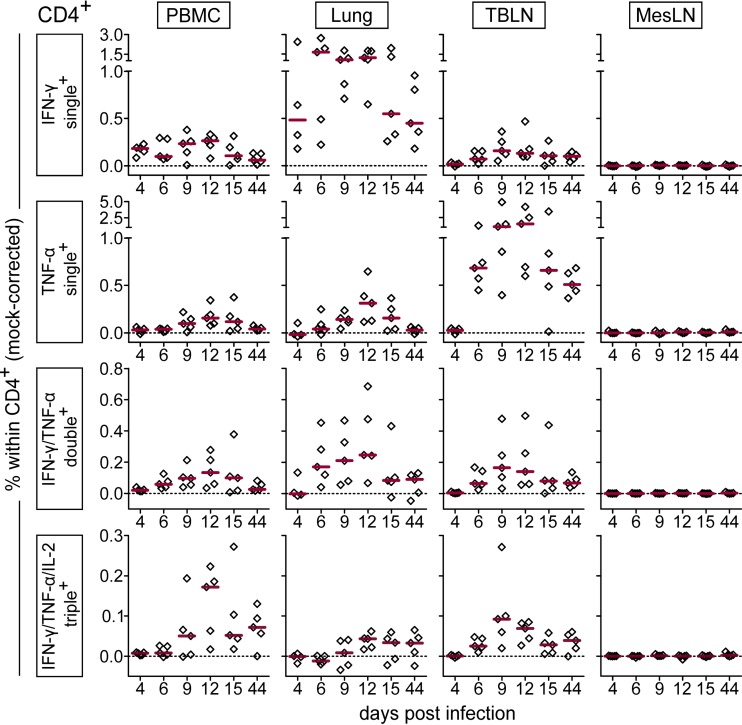
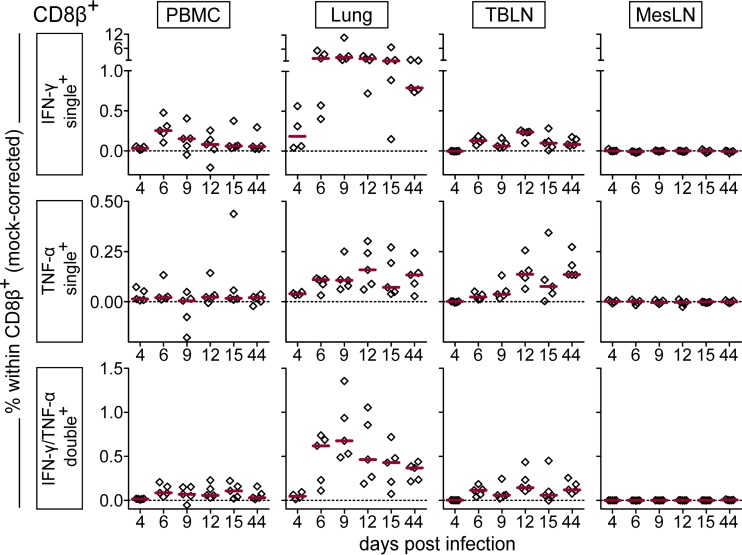
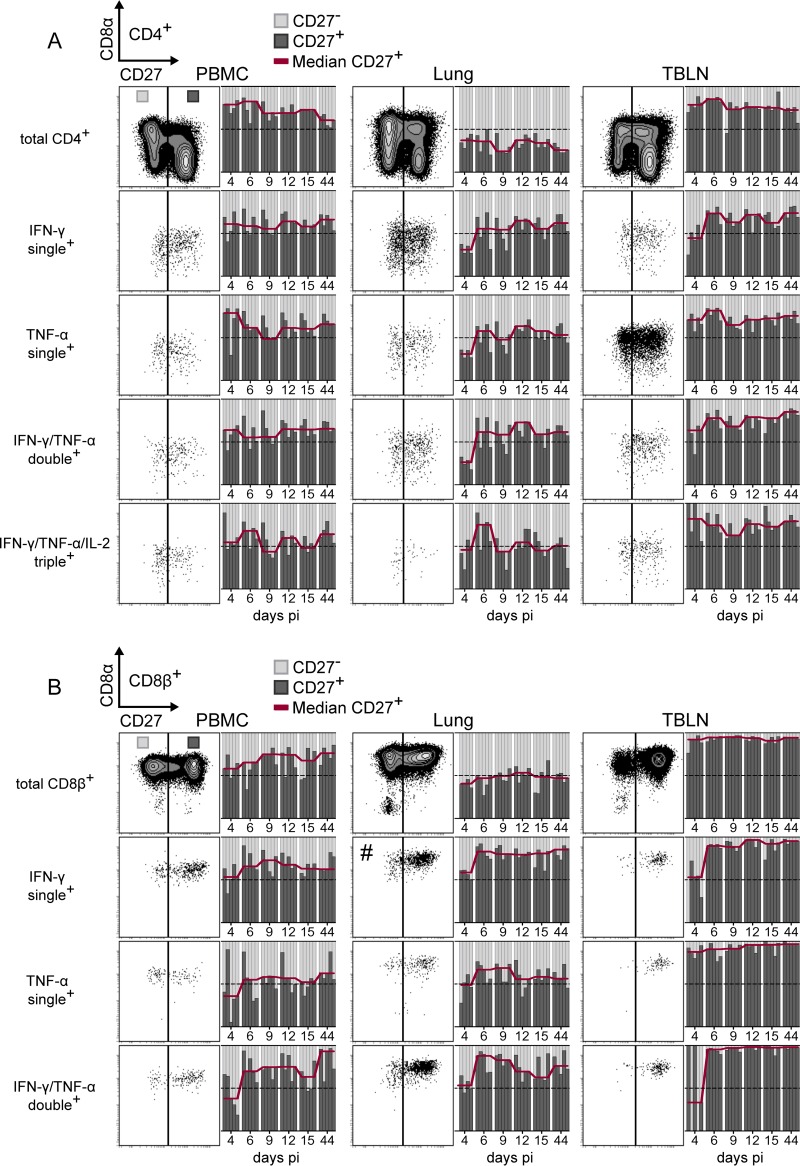
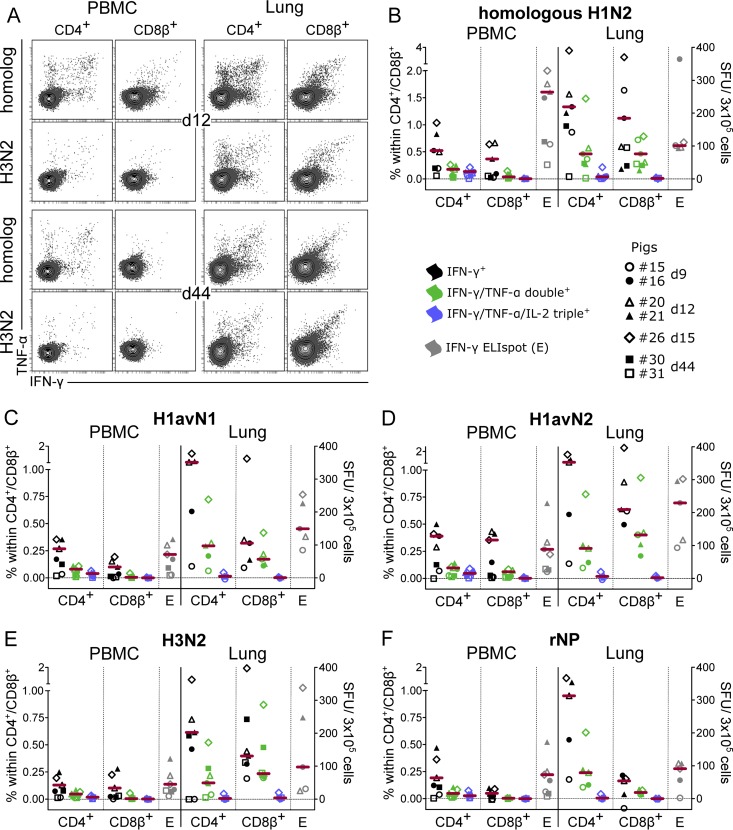
Pigs are natural hosts for influenza A viruses and play a critical role in influenza epidemiology. However, little is known about their influenza-evoked T-cell response. We performed a thorough analysis of both the local and systemic T-cell response in influenza virus-infected pigs, addressing kinetics and phenotype as well as multifunctionality (gamma interferon [IFN-γ], tumor necrosis factor alpha [TNF-α], and interleukin-2 [IL-2]) and cross-reactivity. A total of 31 pigs were intratracheally infected with an H1N2 swine influenza A virus (FLUAVsw) and consecutively euthanized. Lungs, tracheobronchial lymph nodes, and blood were sampled during the first 15 days postinfection (p.i.) and at 6 weeks p.i. Ex vivo flow cytometry of lung lymphocytes revealed an increase in proliferating (Ki-67(+)) CD8(+) T cells with an early effector phenotype (perforin(+) CD27(+)) at day 6 p.i. Low frequencies of influenza virus-specific IFN-γ-producing CD4(+) and CD8(+) T cells could be detected in the lung as early as 4 days p.i. On consecutive days, influenza virus-specific CD4(+) and CD8(+) T cells produced mainly IFN-γ and/or TNF-α, reaching peak frequencies around day 9 p.i., which were up to 30-fold higher in the lung than in tracheobronchial lymph nodes or blood. At 6 weeks p.i., CD4(+) and CD8(+) memory T cells had accumulated in lung tissue. These cells showed diverse cytokine profiles and in vitro reactivity against heterologous influenza virus strains, all of which supports their potential to combat heterologous influenza virus infections in pigs.

Importance: Pigs not only are a suitable large-animal model for human influenza virus infection and vaccine development but also play a central role in the emergence of new pandemic strains. Although promising candidate universal vaccines are tested in pigs and local T cells are the major correlate of heterologous control, detailed and targeted analyses of T-cell responses at the site of infection are scarce. With the present study, we provide the first detailed characterization of magnitude, kinetics, and phenotype of specific T cells recruited to the lungs of influenza virus-infected pigs, and we could demonstrate multifunctionality, cross-reactivity, and memory formation of these cells. This, and ensuing work in the pig, will strengthen the position of this species as a large-animal model for human influenza virus infection and will immediately benefit vaccine development for improved control of influenza virus infections in pigs.


Figures

FIG 1
FIG 1
Animal infection experiments. A total of 62 10-week-old pigs were used in three consecutive animal infection experiments. The overall experiment was split into three separate animal infection experiments, which were performed sequentially, to allow for efficient working practices. In each experiment, the animals were given an adaptation phase of 6 days, before FLUAVsw (infected, n = 31) or PBS (control, n = 31) was applied intratracheally. Application was performed under visual control of a bronchoscope. The photograph shows the tracheal bronchus (TB) and tracheal bifurcation (BF) as seen through the bronchoscope when positioned for application. For tissue collection, animals were euthanized on the indicated days postinfection. Blood samples were taken from both euthanized and surviving animals. The number of euthanized animals (infected plus control) is denoted separately for each study day and makes a total of 5 infected and 5 control animals per time point (with the exception of day 2 p.i., when only two pigs were euthanized). *, the late time points (days 42, 44, and 46) served to address memory responses of T cells; results obtained on these study days were combined and are referred to as “day 44 p.i.” throughout this article.
FIG 2
FIG 2
Clinical findings. Clinical examinations were performed daily from 6 days prior to infection until 15 days p.i. (A) A scoring system was used to evaluate a total of eight clinical parameters. (B) For the two most severe parameters (dyspnea and lung auscultation), the number of animals per score is given over the course of the infection. (C and D) Mean values of summed clinical scores (CS) (C) and rectal temperatures (D) for the infected group (diamonds) and the control group (gray dots). For each day, group means were compared by independent t tests (vertical dashed lines, P < 0.05; asterisks, P < 0.001). Error bars show the standard error of the mean.
FIG 3
FIG 3
Histopathology of lung tissue. (A) Paraffin sections of all seven lung lobes (left cranial, middle, and caudal and right cranial, middle, caudal, and accessory) from PBS-treated control pigs and FLUAVsw-infected pigs were stained with hematoxylin and eosin and examined for the presence and quantity of parameters A to K (defined in the figure). The quantity and presence of each parameter were recorded as a score (0 [absent] to 3 [high grade]). Dot sizes represent the score for one individual animal (day 2) or the mean score for five animals (days 4 to 44). (B) Histopathology scores (HPS) were summed for each individual animal (infected, diamonds; control, gray dots). Horizontal bars indicate the median value for five animals.
FIG 4
FIG 4
Viral load in BALF and neutralizing-antibody titer in serum. (A) Genome equivalent copies (GEC) in bronchoalveolar lavage fluid (BALF) were determined by qRT-PCR and are shown over the course of the infection and for PBS-treated control animals. The limit of detection (LOD) (17,200 GEC/ml) of the qRT-PCR assay was empirically determined using plasmid DNA and is indicated by the dashed line. Values in parentheses give the number of PCR-positive animals and the total number of animals. (B) Infection strain-neutralizing antibodies in blood were assessed by serum neutralization tests. Titers are expressed as the reciprocal 50% neutralizing dose (ND50). Data on 30 infected animals are shown, with lines linking values of individual animals. Numbers in diamonds indicate the number of animals with a certain reciprocal ND50 value at a given time point.
FIG 5
FIG 5
Ex vivo phenotypes of CD4+ and CD8αhigh T cells in lungs and tracheobronchial lymph nodes (TBLN). (A) CD4+ T cells were gated for expression of Ki-67 and CD8α and differentiated according to their expression of CD27. (D) CD8αhigh T cells were gated for expression of Ki-67 and perforin and differentiated according to their expression of CD27. (B, C, E, and F) Respective subsets (red gate, CD27+; blue gate, CD27) are displayed as the percentage of total CD4+ T cells (B and C) or CD8αhigh T cells (E and F) over time for infected animals (diamonds) and pooled for PBS-treated control animals (c) (gray dots). Median percent values for 30 control animals and 5 infected animals per time point are indicated by the colored bars. The dashed horizontal line indicates the level of the median of the control group.
FIG 6
FIG 6
IFN-γ response to viral restimulation (ELISpot assay). Freshly isolated cells were restimulated in vitro with FLUAVsw (infection strain, MOI = 0.1) for 24 h or incubated with medium or mock treated. Frequencies of IFN-γ-producing cells were calculated by subtracting spot numbers of mock-incubated cultures from spot numbers detected after viral restimulation (mock corrected). Results for PBMC include surviving animals. Red bars show median values. The zero level is indicated by the dashed horizontal line.
FIG 7
FIG 7
Production of IFN-γ, TNF-α, and IL-2 by CD4+ T cells. Intracellular cytokine staining was performed following overnight in vitro restimulation of freshly isolated cells with FLUAVsw (infection strain, MOI = 0.1; 18 h). Contour plots show cytokine production of CD4+ T cells (gated on CD4+ CD8β cells [not shown]) isolated from blood (PBMC), lungs, tracheobronchial lymph nodes (TBLN), and mesenteric lymph nodes (MesLN) of animals representative for each time point postinfection. Approximately 120,000 CD4+ T cells are shown in each contour plot.
FIG 8
FIG 8
Production of IFN-γ, TNF-α, and IL-2 by CD8+ T cells. Intracellular cytokine staining was performed following overnight in vitro restimulation of freshly isolated cells with FLUAVsw (infection strain, MOI = 0.1; 18 h). Contour plots show cytokine production of CD8+ T cells (gated on CD4 CD8β+ cells [not shown]) isolated from blood (PBMC), lungs, tracheobronchial lymph nodes (TBLN), and mesenteric lymph nodes (MesLN) of animals representative for each time point postinfection. Approximately 120,000 CD8+ T cells are shown in each contour plot.
FIG 9
FIG 9
Frequency of IFN-γ-, TNF-α-, and IL-2-producing CD4+ T cells over the course of infection. Intracellular cytokine staining was performed following overnight in vitro restimulation of freshly isolated cells with FLUAVsw (infection strain, MOI = 0.1; 18 h). Mock-incubated cells served as negative controls. Frequencies of cytokine-defined subsets were obtained by Boolean gating. Mock-corrected percent values (percentage after virus restimulation minus percentage after mock incubation) of total CD4+ CD8β T cells are shown for the most frequent cytokine-defined subsets. The zero level is indicated by the dashed horizontal line. Red bars show the median value for 5 animals per subset, organ, and time point.
FIG 10
FIG 10
Frequency of IFN-γ- and TNF-α-producing CD8+ T cells over the course of infection. Intracellular cytokine staining was performed following overnight in vitro restimulation of freshly isolated cells with FLUAVsw (infection strain, MOI = 0.1; 18 h). Mock-incubated cells served as negative controls. Frequencies of cytokine-defined subsets were obtained by Boolean gating. Mock-corrected percent values (percentage after virus restimulation minus percentage after mock incubation) of total CD4 CD8β+ T cells are shown for the most frequent cytokine-defined subsets. The zero level is indicated by the dashed horizontal line. Red bars show the median value for 5 animals per subset, organ, and time point.
FIG 11
FIG 11
CD27 expression by cytokine-producing T cells. Intracellular cytokine staining of lymphocytes isolated from blood (PBMC), lungs, and tracheobronchial lymph nodes (TBLN) was performed after in vitro restimulation as described for Fig. 7 to 10. Cytokine-defined subsets identified by Boolean gating were analyzed for CD27 expression. Exemplary contour plots and dot plots show CD27 expression on total (approximately 80,000) CD4+ T cells (A) or CD8+ T cells (B) and on cytokine-defined subsets. Adjacent bar graphs show the ratio of CD27+ (dark gray) and CD27 (light gray) cells within the respective cell population over time. Each column within a time frame corresponds to an individual animal. The red line connects median values for CD27+ cells of 5 animals per time point. The dotted horizontal line represents the 50% mark. For more accurate representation of subsets, the dot plot showing singly IFN-γ-producing CD8+ T cells in the lung (#) was set to display only 10% of events.
FIG 12
FIG 12
Cytokine response to restimulation with heterologous influenza A virus and nucleoprotein. For intracellular cytokine staining (ICS) and IFN-γ ELISpot assays, defrosted PBMC and lung cells were restimulated with different influenza virus strains (MOI = 0.3) and recombinant influenza virus nucleoprotein (rNP) (1 μg/ml). Mock-incubated cultures served to determine background production. (A) Contour plots show IFN-γ and TNF-α production of CD4+ (gated on CD4+ CD8β cells [not shown]) and CD8+ T cells (gated on CD4 CD8β+ cells [not shown]) isolated from blood (PBMC) and lungs of pig 20 (day 12) and pig 30 (day 44). Approximately 50,000 CD4+ or CD8+ T cells are shown in each plot. (B to F) Mock-corrected frequencies of cytokine-defined subsets within CD4+ or CD8+ T cells and mock-corrected spot-forming units (SFU) (IFN-γ ELISpot assay) in response to the indicated influenza virus strains and rNP are shown for 5 to 7 animals. The zero level is indicated by the dashed horizontal line. Due to cell shortage, lung cells from day 44 were tested only by ICS after incubation with homologous H1N2, heterologous H3N2, and respective mock controls. Red bars show the median, excluding values for the last time point (day 44) p.i.

Similar articles

Cited by

References

    1. Doherty PC, Turner SJ, Webby RG, Thomas PG. 2006. Influenza and the challenge for immunology. Nat Immunol 7:449–455. doi:10.1038/ni1343. - DOI - PubMed
    1. Ito T, Couceiro JN, Kelm S, Baum LG, Krauss S, Castrucci MR, Donatelli I, Kida H, Paulson JC, Webster RG, Kawaoka Y. 1998. Molecular basis for the generation in pigs of influenza A viruses with pandemic potential. J Virol 72:7367–7373. - PMC - PubMed
    1. Ma W, Kahn RE, Richt JA. 2008. The pig as a mixing vessel for influenza viruses: human and veterinary implications. J Mol Genet Med 3:158–166. - PMC - PubMed
    1. Ma W, Lager KM, Vincent AL, Janke BH, Gramer MR, Richt JA. 2009. The role of swine in the generation of novel influenza viruses. Zoonoses Public Health 56:326–337. doi:10.1111/j.1863-2378.2008.01217.x. - DOI - PubMed
    1. Myers KP, Olsen CW, Gray GC. 2007. Cases of swine influenza in humans: a review of the literature. Clin Infect Dis 44:1084–1088. doi:10.1086/512813. - DOI - PMC - PubMed

Publication types

MeSH terms

Grants and funding

This work was supported by a start-up project grant (PP35010261) from the University of Veterinary Medicine Vienna to Wilhelm Gerner. Stephanie C. Talker was supported by a Vetmeduni success stipend from the University of Veterinary Medicine Vienna and by the Graduate School for Pig and Poultry Medicine, University of Veterinary Medicine Vienna.