. 2016 Aug 11;166(4):977-990.
doi: 10.1016/j.cell.2016.07.006. Epub 2016 Aug 4.

Memory of Inflammation in Regulatory T Cells

Affiliations

Memory of Inflammation in Regulatory T Cells

Joris van der Veeken et al. Cell. .

Abstract

Eukaryotic cells can "remember" transient encounters with a wide range of stimuli, inducing lasting states of altered responsiveness. Regulatory T (Treg) cells are a specialized lineage of suppressive CD4 T cells that act as critical negative regulators of inflammation in various biological contexts. Treg cells exposed to inflammatory conditions acquire strongly enhanced suppressive function. Using inducible genetic tracing, we analyzed the long-term stability of activation-induced transcriptional, epigenomic, and functional changes in Treg cells. We found that the inflammation-experienced Treg cell population reversed many activation-induced changes and lost its enhanced suppressive function over time. The "memory-less" potentiation of Treg suppressor function may help avoid a state of generalized immunosuppression that could otherwise result from repeated activation.


Figures

Figure 1
Figure 1. Generation and fate mapping of inflammation-experienced Treg cells
a) Experimental design schematic. Bone marrow chimeric (BMC) mice were treated with diphtheria toxin (DT) followed by tamoxifen (T) on days 3 and 4 post-DT treatment. b, c) Frequency and total numbers of CD44+CD62LFoxp3 CD4 T cells in spleen on day 0, day 11, and day 60 post-DT treatment. d, e) Frequency and total numbers of YFP+ Treg cells in spleen on day 0, day 11, and day 60 post-DT. Data are representative of 2 independent experiments. *, P<0.05; **, P<0.01; ***, P<0.001. P-values were calculated using one-way ANOVA with Tukey’s multiple comparisons test. Error bars show mean with S.E.M.
Figure 2
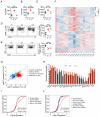
Figure 2. Stability of inflammation-induced transcriptional changes in Treg cells
a-e) FACS analysis of ICOS (a), GITR (b), Foxp3 (c), CD44 and CD62L (d), and CD25 (e) protein levels in YFP+ Treg cells from the spleen of BMC mice on day 0 (rTr), day 11 (aTr), and day 60 (mTr) post DT treatment. *, p<0.05; **, p<0.01; ***, p<0.001, ****, p<0.0001. P-values from one-way ANOVA with Tukey’s multiple comparisons test. f) Heatmap of stable and transient gene expression changes in bulk GFP+ rTr, and YFP+ aTr, and mTr populations from peripheral lymphoid organs analyzed by RNA-seq. g) Gene expression changes in rTr vs aTr cells (x-axis) and rTr vs mTr cells (y-axis). All present genes are shown in grey. Gene group classifications require statistically significant (FDR<5%) changes in at least two cell state comparisons to avoid bias for detection of either stable or transient changes (see Experimental Procedures). h) Log2 normalized RNA-seq counts for selected genes. i-j) activation-induced changes in TCR- (l), and Foxo1- (m) dependent gene signatures. P-values calculated using one-sided Kolmogorov–Smirnov (KS) test comparing signature genes to all genes. Plots are generated using pooled RNA-seq data from two independent experiments (Experiment 1: rTr1-3, aTr1-3, mTr1-4; Experiment2: rTr4-5, aTr4-5, mTr5,6)
Figure 3
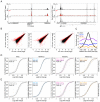
Figure 3. Transient gene expression changes are not commonly associated with chromatin-level memory
a) ATAC-seq tracks for genes undergoing transient activation-induced up-(Gzmb) or downregulation (Igf1r). b) Scatter plots of ATAC-seq changes. Significant changes (FDR ≤ 5%) are highlighted in red. c) Metapeak plot of histone modifications in 1kb window surrounding ATAC-seq peaks in rTr cells. d,e) Distribution of chromatin changes in a 1kb window surrounding ATAC-seq peaks associated with transiently up- (d) or downregulated (e) genes. P-values calculated using one-sided KS test comparing peaks associated with transiently regulated genes to all peaks. Directionality of the KS tests logically corresponds with the directionality of gene expression changes. RtoA (rTr to aTr), AtoM (aTr to mTr), RtoM (rTr to mTr). NS (p>0.001).
Figure 4
Figure 4. Transient activation-induced increase in H3K27me3 at Foxp3 bound sites
a) Association between Foxp3 binding and activation-induced H3K27me3. Comparing all (24999) H3K27me3 peaks and domains to those near (<40kb) a Foxp3 target (6656). b) Relationship between Foxp3 ChIP-seq read count and activation-induced H3K27me3 changes for regions near a Foxp3 target site. c) Relationship between distance to nearest Foxp3 peak and activation-induced H3K27me3 changes for regions near a highly occupied (normalized counts >50) Foxp3 target (561 peaks and domains total).
Figure 5
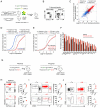
Figure 5. Transient Treg cell activation signature is regulated similarly upon secondary challenge
a, b) Experimental design schematic. GFP+YFP+ aTr or mTr cells were transferred together with resting GFP+YFP Treg cells and pre-activated Foxp3 Ly5.1+ CD4 effector T cells into TCRβδ−/− recipients (a). Treg cells were isolated from secondary lymphoid organs two weeks post-transfer and analyzed by RNA-seq. c) Gene expression changes in rTr cells before and after transfer (“primary activation”) on x-axis and changes in gene expression in rTr compared to reactivated mTr cells (“secondary activation”) on y-axis. Gene expression groups defined in Fig 2g are highlighted. d,e) Distribution of expression changes induced by primary and secondary activation. Transiently regulated genes (d) and TCR-dependent genes (e) are shown. P-values calculated using a one-sided KS test. f) Log2 normalized RNA-seq counts for selected genes. g) Experimental design schematic to compare recall responses of LCMV-experienced Treg and Teff cells. Polyclonal mTe and mTr populations were isolated 60 days after LCMV infection and tamoxifen treatment of Foxp3GFP-DTRCD4CreERT2R26tdTomato mice (see Fig S2f) and mixed at equal ratios with Tomato naïve CD4 (rTn) or rTr cells, respectively. Cells were labeled with CellTraceTM and transferred into congenically marked, LCMV-infected recipients. h-j) FACS analysis of (h) CellTraceTM, (i) CD44 and CD62L, (j) CD25 and CXCR3 staining on day 11 p.i. *, P<0.05; **, P< 0.01. P-values calculated using T-test. Error bars show mean with S.E.M. Representative of two (i,j) or three (h) independent experiments.
Figure 6
Figure 6. Treg cell activation transiently enhances suppressive function and imprints stable non-lymphoid tissue preference
a) In vitro suppression assay using rTr, aTr, and mTr cells from mixed BMCs. Pooled data from two independent experiments with a total of 6 replicates per condition are shown. Statistical tests compare mTr vs rTr, or mTr vs aTr. b, c) In vivo suppression assay using rTr and mTr populations from Foxp3GFP-DTRCD4CreERT2R26tdTomato mice. Prevention of weight loss (wasting disease) (b) and suppression of T cell expansion (c) are shown. The data represent one of two independent experiments with at least 3 mice per group. d) Selection of GO-terms enriched among genes undergoing stable transcriptional changes (from Fig 2g). e) GFP+YFP+ aTr or mTr cells were transferred together with GFP+YFP rTr cells and activated Foxp3 Ly5.1+ CD4 effector T cells into TCRβδ−/− recipients, as shown in Fig 5a. Mice were analyzed two weeks post-transfer. Ratios of YFP+ to YFP Treg cells were normalized to the ratio in the spleen. The pooled data from two independent experiments are shown with a total of 11 mice per group. *, P<0.05; **, P< 0.01; ***, P<0.001; ****, P<0.0001. P-values calculated using two-way ANOVA (a, c) or one-way ANOVA (e) with Tukey’s multiple comparisons test. Error bars show mean with S.E.M.
Figure 7
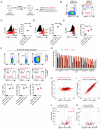
Figure 7. Treg cells and conventional memory T cells share a gene signature not stably affected by secondary activation
a,b) Experimental design schematic. LCMV-specific GP66-tetramer+ memory CD4 T cells were isolated 60 days p.i and transferred to congenically marked recipients. Recipients were infected with LCMV and 60 days later primary and secondary memory T cells were isolated. c-d) Flow cytometric analysis of IL18R (c), CXCR3 (d), CD73 (e) staining. f) Cytokine production after in vitro stimulation with GP61-80 peptide for 6h at 37 degrees in the presence of brefeldin A. Representative of two independent experiments. Error bars show mean with S.E.M. g-k) RNA-seq of primary and secondary memory T cells. (g) Expression of a set of immune response genes, (h) FC-FC plot showing log2 fold change in naïve CD4 (Tn) vs primary memory (mem1) and in mem1 vs secondary memory (mem2). Differentially expressed genes (FDR<5%) are highlighted. (i) FC-FC plot showing Tn vs mem1 and Tn vs mem2. j,k) Volcano plots showing differential gene expression in Tn vs mem1 (j) and mem1 vs mem2 (k). Genes differentially expressed in Treg compared to Tn (FDR<5% and FC>2) are highlighted. Number of significantly (FDR<5%) up- or downregulated Treg-signature genes is shown. **, P< 0.01; ****, P<0.0001. P-values were calculated using one-way ANOVA (c-f) with Tukey’s multiple comparisons test or Chi-square test (j,k).

Similar articles

Cited by

References

    1. Angelosanto JM, Blackburn SD, Crawford A, Wherry EJ. Progressive loss of memory T cell potential and commitment to exhaustion during chronic viral infection. J Virol. 2012;86:8161–8170. - PMC - PubMed
    1. Arpaia N, Green JA, Moltedo B, Arvey A, Hemmers S, Yuan S, Treuting PM, Rudensky AY. A Distinct Function of Regulatory T Cells in Tissue Protection. Cell. 2015;162:1078–1089. - PMC - PubMed
    1. Arvey A, van der Veeken J, Samstein RM, Feng Y, Stamatoyannopoulos JA, Rudensky AY. Inflammation-induced repression of chromatin bound by the transcription factor Foxp3 in regulatory T cells. Nat Immunol. 2014;15:580–587. - PMC - PubMed
    1. Belkaid Y, Tarbell K. Regulatory T cells in the control of host-microorganism interactions (*) Annual review of immunology. 2009;27:551–589. - PubMed
    1. Berg RE, Crossley E, Murray S, Forman J. Memory CD8+ T cells provide innate immune protection against Listeria monocytogenes in the absence of cognate antigen. The Journal of experimental medicine. 2003;198:1583–1593. - PMC - PubMed

Publication types