

Twist1-induced epithelial-mesenchymal transition according to microsatellite instability status in colon cancer cells
- PMID: 27494849
- PMCID: PMC5302973
- DOI: 10.18632/oncotarget.10974
Twist1-induced epithelial-mesenchymal transition according to microsatellite instability status in colon cancer cells
Abstract
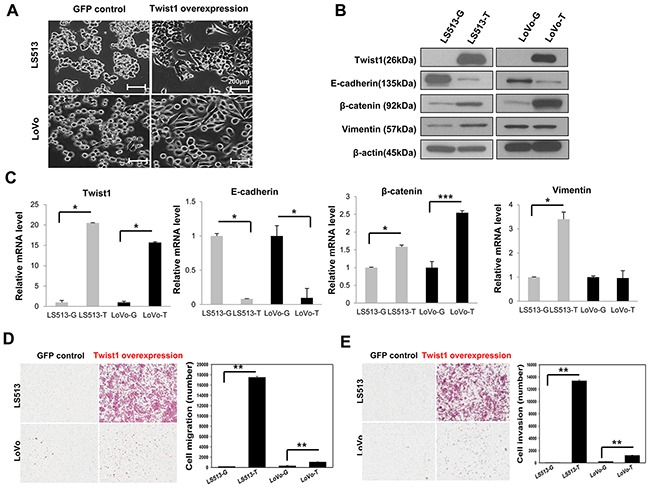
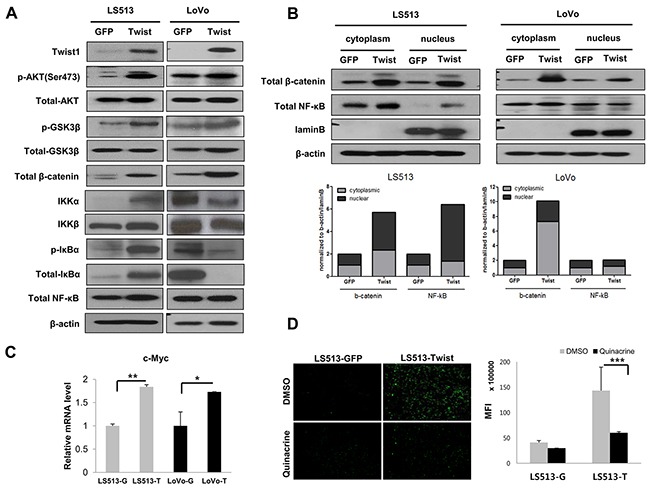
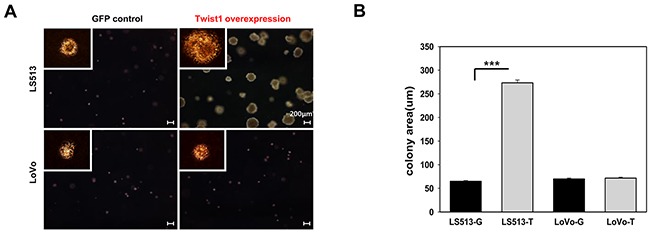
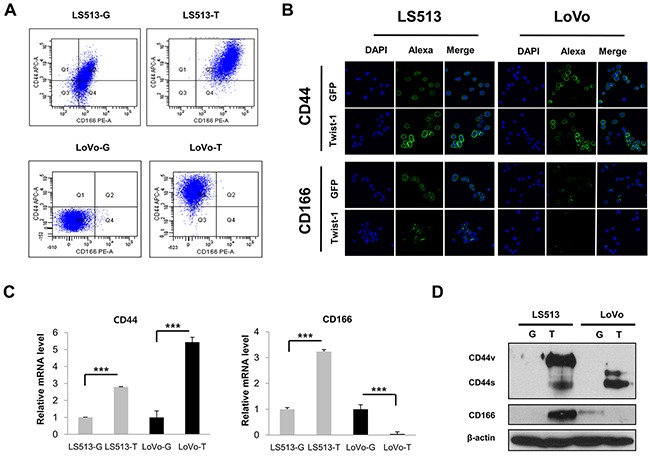
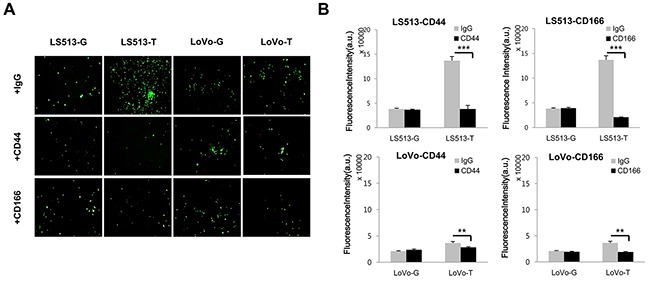
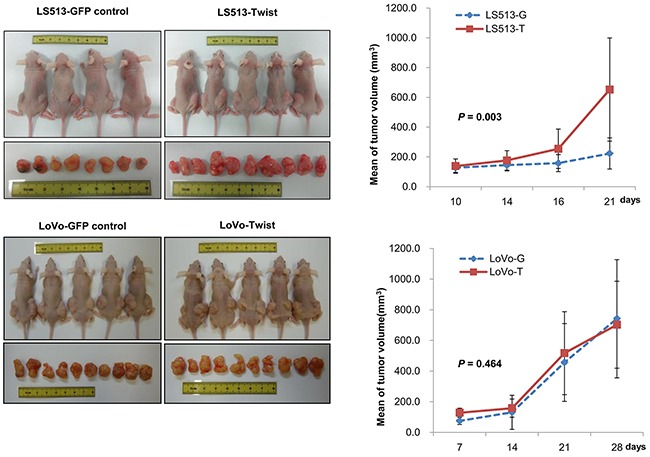
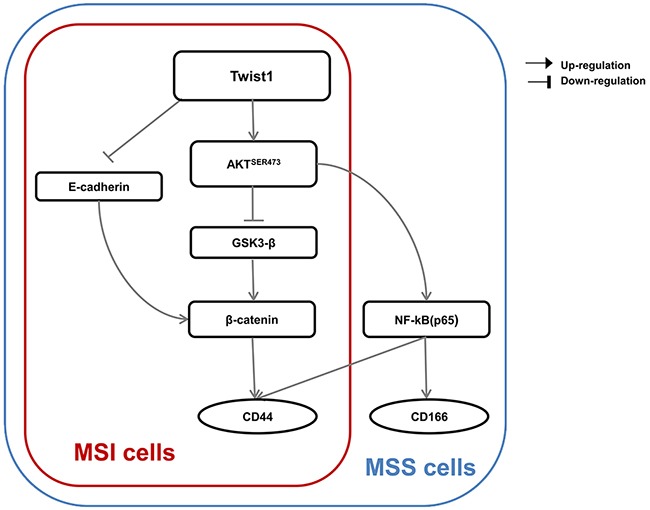
Colorectal cancer (CRC) with microsatellite instability (MSI) may exhibit impaired epithelial-mesenchymal transition (EMT), but little is known about the underlying mechanisms of this phenomenon. In this study, we investigated the role of Twist1 and its downstream signaling cascades in EMT induction according to MSI status. To investigate the effects of Twist1 on EMT induction according to MSI status, MSS LS513 and MSI LoVo colon cancer cell lines, which overexpress human Twist1, were generated. Twist1-induced EMT and its downstream signaling pathways were evaluated via in vitro and in vivo experiments. We found that Twist1 induced EMT markers and stem cell-like characteristics via AKT signaling pathways. Twist1 induced activation of AKT and suppression of glycogen synthase kinase (GSK)-3β, which resulted in the activation of β-catenin, increasing CD44 expression. In addition, Twist1 activated the AKT-induced NF-κB pathway, increasing CD44 and CD166 expression. Activation of both the AKT/GSK-3β/β-catenin and AKT/NF-κB pathways occurred in MSS LS513 cells, while only the AKT/GSK-3β/β-catenin pathway was activated in MSI LoVo cells. In conclusion, Twist1 induces stem cell-like characteristics in colon cancer cell lines related to EMT via AKT signaling pathways, and those pathways depend on MSI status.
Keywords: Twist1; colorectal cancer; epithelial to mesenchymal transition; microsatellite instability.
Conflict of interest statement
Conflicts of Interest: None declared.
Figures
Similar articles
-
Synergistic effects of CD44 and TGF-β1 through AKT/GSK-3β/β-catenin signaling during epithelial-mesenchymal transition in liver cancer cells.Biochem Biophys Res Commun. 2016 Sep 2;477(4):568-574. doi: 10.1016/j.bbrc.2016.06.077. Epub 2016 Jun 16. Biochem Biophys Res Commun. 2016. PMID: 27320862
-
Presence of Twist1-positive neoplastic cells in the stroma of chromosome-unstable colorectal tumors.Gastroenterology. 2013 Sep;145(3):647-57.e15. doi: 10.1053/j.gastro.2013.05.011. Epub 2013 May 15. Gastroenterology. 2013. PMID: 23684708
-
Emodin represses TWIST1-induced epithelial-mesenchymal transitions in head and neck squamous cell carcinoma cells by inhibiting the β-catenin and Akt pathways.Eur J Cancer. 2014 Jan;50(2):366-78. doi: 10.1016/j.ejca.2013.09.025. Epub 2013 Oct 21. Eur J Cancer. 2014. PMID: 24157255
-
The role of TWIST1 in epithelial-mesenchymal transition and cancers.Tumour Biol. 2016 Jan;37(1):185-97. doi: 10.1007/s13277-015-4450-7. Epub 2015 Nov 24. Tumour Biol. 2016. PMID: 26602382 Review.
-
The interplay between microRNAs and Twist1 transcription factor: a systematic review.Tumour Biol. 2016 Jun;37(6):7007-19. doi: 10.1007/s13277-016-4960-y. Epub 2016 Feb 15. Tumour Biol. 2016. PMID: 26880587 Review.
Cited by
-
Low expression of Talin1 is associated with advanced pathological features in colorectal cancer patients.Sci Rep. 2020 Oct 20;10(1):17786. doi: 10.1038/s41598-020-74810-6. Sci Rep. 2020. PMID: 33082414 Free PMC article.
-
Node-negative colon cancer: histological, molecular, and stromal features predicting disease recurrence.Mol Med. 2023 Jun 21;29(1):77. doi: 10.1186/s10020-023-00677-8. Mol Med. 2023. PMID: 37344790 Free PMC article.
-
Experimental and Meta-Analytic Validation of RNA Sequencing Signatures for Predicting Status of Microsatellite Instability.Front Mol Biosci. 2021 Nov 23;8:737821. doi: 10.3389/fmolb.2021.737821. eCollection 2021. Front Mol Biosci. 2021. PMID: 34888350 Free PMC article.
-
EPS364, a Novel Deep-Sea Bacterial Exopolysaccharide, Inhibits Liver Cancer Cell Growth and Adhesion.Mar Drugs. 2021 Mar 22;19(3):171. doi: 10.3390/md19030171. Mar Drugs. 2021. PMID: 33809909 Free PMC article.
-
Downregulation of CD166 inhibits invasion, migration, and EMT in the radio-resistant human nasopharyngeal carcinoma cell line CNE-2R.Cancer Manag Res. 2019 Apr 26;11:3593-3602. doi: 10.2147/CMAR.S194685. eCollection 2019. Cancer Manag Res. 2019. PMID: 31114384 Free PMC article.
References
-
- Kim A, Bae YK, Gu MJ, Kim JY, Jang KY, Bae HI, Lee HJ, Hong SM. Epithelial-mesenchymal transition phenotype is associated with patient survival in small intestinal adenocarcinoma. Pathology. 2013;45:567–573. - PubMed
-
- Thiery JP. Epithelial-mesenchymal transitions in tumour progression. Nat Rev Cancer. 2002;2:442–454. - PubMed
-
- Thiery JP, Sleeman JP. Complex networks orchestrate epithelial-mesenchymal transitions. Nat Rev Mol Cell Biol. 2006;7:131–142. - PubMed
-
- Celesti G, Di Caro G, Bianchi P, Grizzi F, Basso G, Marchesi F, Doni A, Marra G, Roncalli M, Mantovani A, Malesci A, Laghi L. Presence of Twist1-positive neoplastic cells in the stroma of chromosome-unstable colorectal tumors. Gastroenterology. 2013;145:647–657. e615. - PubMed
MeSH terms
Substances
LinkOut - more resources
Full Text Sources
Other Literature Sources
Molecular Biology Databases
Research Materials
Miscellaneous
