. 2016 Aug 5;11(8):e0158047.
doi: 10.1371/journal.pone.0158047. eCollection 2016.

Amplification of TGFβ Induced ITGB6 Gene Transcription May Promote Pulmonary Fibrosis

Affiliations

Amplification of TGFβ Induced ITGB6 Gene Transcription May Promote Pulmonary Fibrosis

Amanda L Tatler et al. PLoS One. .

Abstract

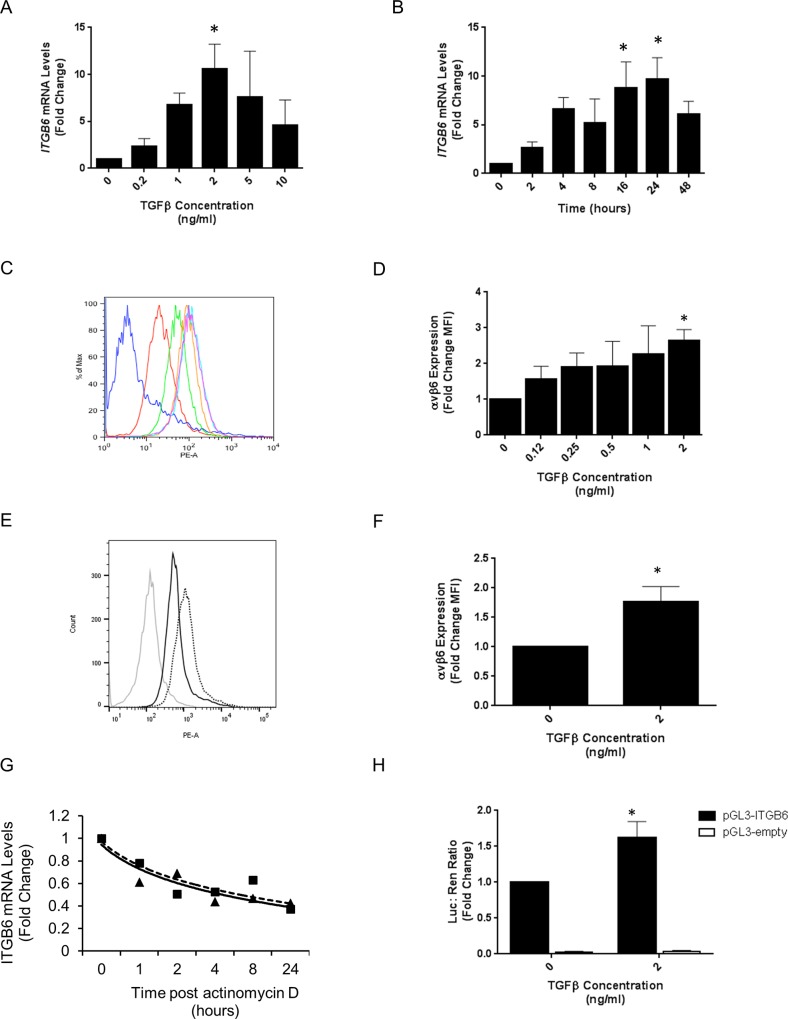
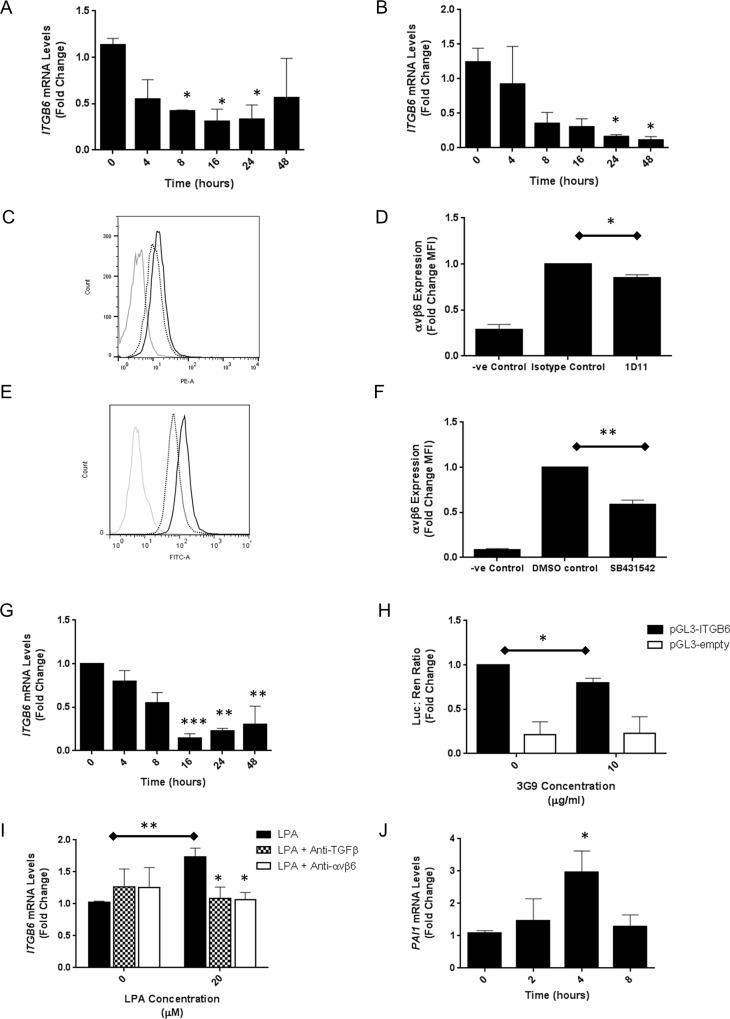
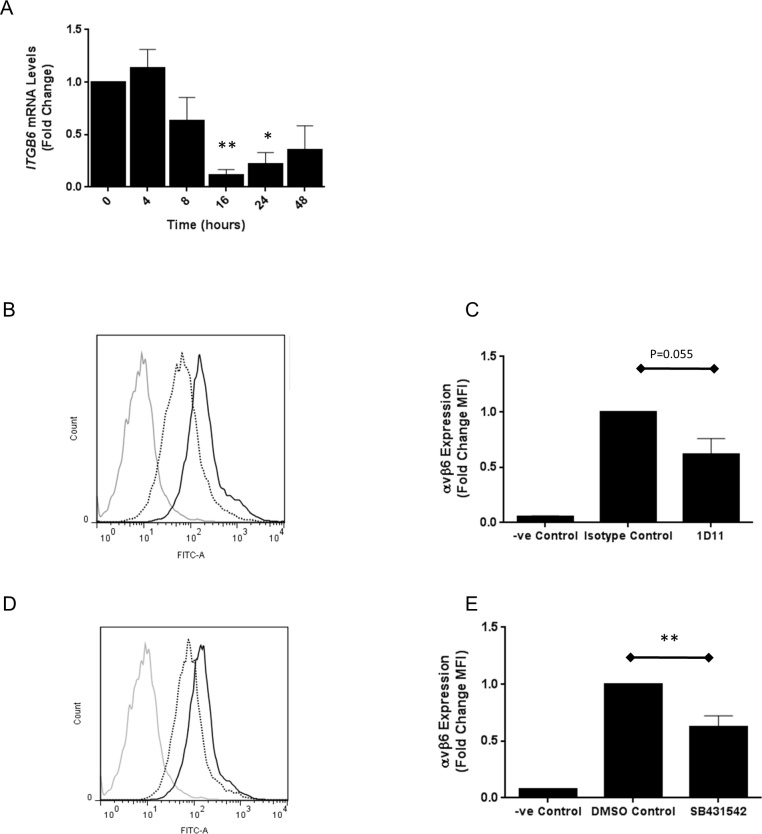
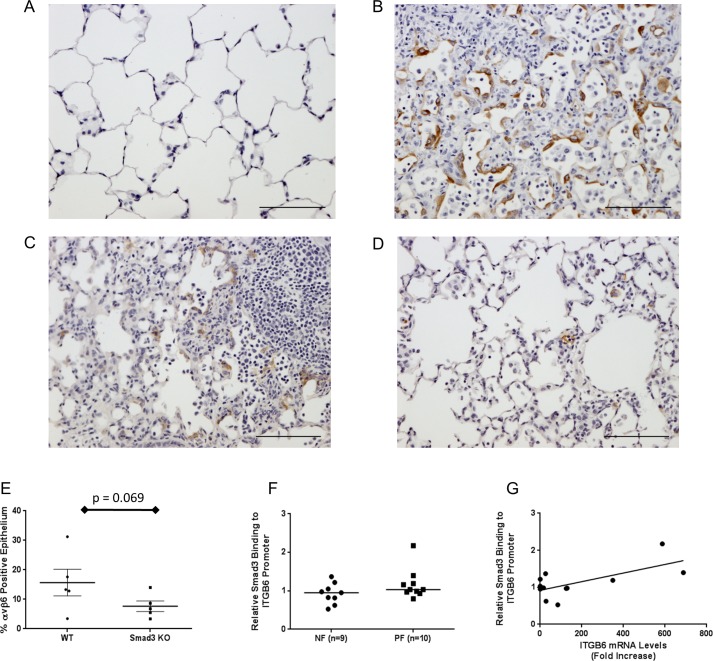
Idiopathic pulmonary fibrosis (IPF) is a devastating, progressive disease with poor survival rates and limited treatment options. Upregulation of αvβ6 integrins within the alveolar epithelial cells is a characteristic feature of IPF and correlates with poor patient survival. The pro-fibrotic cytokine TGFβ1 can upregulate αvβ6 integrin expression but the molecular mechanisms driving this effect have not previously been elucidated. We confirm that stimulation with exogenous TGFβ1 increases expression of the integrin β6 subunit gene (ITGB6) and αvβ6 integrin cell surface expression in a time- and concentration-dependent manner. TGFβ1-induced ITGB6 expression occurs via transcriptional activation of the ITGB6 gene, but does not result from effects on ITGB6 mRNA stability. Basal expression of ITGB6 in, and αvβ6 integrins on, lung epithelial cells occurs via homeostatic αvβ6-mediated TGFβ1 activation in the absence of exogenous stimulation, and can be amplified by TGFβ1 activation. Fundamentally, we show for the first time that TGFβ1-induced ITGB6 expression occurs via canonical Smad signalling since dominant negative constructs directed against Smad3 and 4 inhibit ITGB6 transcriptional activity. Furthermore, disruption of a Smad binding site at -798 in the ITGB6 promoter abolishes TGFβ1-induced ITGB6 transcriptional activity. Using chromatin immunoprecipitation we demonstrate that TGFβ1 stimulation of lung epithelial cells results in direct binding of Smad3, and Smad4, to the ITGB6 gene promoter within this region. Finally, using an adenoviral TGFβ1 over-expression model of pulmonary fibrosis we demonstrate that Smad3 is crucial for TGFβ1-induced αvβ6 integrin expression within the alveolar epithelium in vivo. Together, these data confirm that a homeostatic, autocrine loop of αvβ6 integrin activated TGFβ1-induced ITGB6 gene expression regulates epithelial basal αvβ6 integrin expression, and demonstrates that this occurs via Smad-dependent transcriptional regulation at a single Smad binding site in the promoter of the β6 subunit gene. Active TGFβ1 amplifies this pathway both in vitro and in vivo, which may promote fibrosis.


Conflict of interest statement

Competing Interests: SMV and PHW are employees of Biogen Idec. This does not alter our adherence to PLOS One policies on sharing data and materials. GJ has Sponsored Research Agreements with GlaxoSmithKline, Novartis and Biogen Idec, has performed consultancy for InterMune, MedImmune, Boehringer Ingelheim, Biogen Idec and Pulmatrix, and has received speakers' fees from Boehringer Ingelheim, MedImmune and Roche. All non-commercially available materials described in the manuscript will be able available on request subject to a material transfer agreement between both parties.

Figures

Fig 1
Fig 1
A. iHBECs were treated with increasing concentrations of TGFβ1 for 16 hours and ITGB6 mRNA was measured by QPCR. Data are expressed as mean expression relative to control (0 ng/ml) ± SEM from three independent experiments. * p < 0.05 B. iHBECs were treated with 2 ng/ml TGFβ1 for over 48 hours and ITGB6 mRNA was measured by QPCR at increasing time points. Data are expressed as mean expression relative to control (0 h) ± SEM from three independent experiments. * p < 0.05 C. iHBECs were treated with increasing concentrations of TGFβ1 (red = 0, green = 0.12, orange = 0.25, pink = 0.5, light blue = 1 and purple = 2 ng/ml. Dark blue = negative control) for 7 days and αvβ6 cell surface expression measured by flow cytometry. Experiment was repeated three times and histogram shows representative data from single experimental repeat. D. Amalgamated data from three independent experimental repeats of the experiment described in Fig 1C are demonstrated as a bar chart showing mean fold change in mean fluorescence intensity (MFI) ± SEM. * p < 0.05 E. iHBECs were treated with 0 or 2 ng/ml TGFβ1 for three days and αvβ6 integrin cell surface expression was measured by flow cytometry. Grey line = negative control, black line = 0 ng/ml TGFβ, black dotted line = 2 ng/ml TGFβ. Experiment was repeated three times and histogram shows representative data from single experimental repeat. F. iHBECs were treated with 2 ng/ml TGFβ1 for three days and αvβ6 integrin cell surface expression was measured by flow cytometry. Amalgamated data from three independent experiments are expressed as mean fold change in MFI ± SEM. * p < 0.05 G. iHBECs were treated with 0 or 2 ng/ml TGFβ1 for 4 hours followed by 5 μg/ml actinomycin D. ITGB6 mRNA levels were then measured by QPCR at increasing time points up to 24 hours. Data are expressed as mean expression relative to control (0 h) ± SEM from three independent experiments. H. iHBECs transfected with either pGL3-ITGB6 or empty pGL3 as a control were treated with 0 or 2 ng/ml TGFβ1 for 4 hours. Data are expressed as mean relative firefly / renilla luciferase ratio ± SEM from three independent experiments. * p < 0.05.
Fig 2
Fig 2
A. iHBECs were treated with 10 μg/ml anti-TGFβ and ITGB6 mRNA was measured by QPCR at increasing time points. Data are expressed as mean expression relative to control (0 h) ± SEM from three independent experiments. * p < 0.05 B. iHBECs were treated with 10 μM Alk5 inhibitor and ITGB6 mRNA was measured by QPCR at increasing time points. Data are expressed as mean expression relative to control (0 h) ± SEM from three independent experiments. * p < 0.05 C. iHBECs were treated with 10 μg/ml anti-TGFβ or an isotype control and αvβ6 cell surface expression was measured by flow cytometry after 3 days. Three independent experiments were performed and histogram shows representative data from one experimental repeat. Grey = negative control, black solid = 0 μg/ml, black dotted = 10 μg/ml. D. Amalgamated data from three independent experimental repeats of the experiment described in Fig 2C are demonstrated as a bar chart showing mean fold change in MFI ± SEM. * p < 0.05 E. iHBECs were treated with 0 or 10 μM Alk5 inhibitor (SB431542) and αvβ6 cell surface expression was measured by flow cytometry after 3 days. Three independent experiments were performed and histogram shows representative data from one experimental repeat. Grey = negative control, black solid = 0 μM, black dotted = 10 μM. F. Amalgamated data from three independent experimental repeats of the experiment described in Fig 2E are demonstrated as a bar chart showing mean fold change in MFI ± SEM. ** p < 0.01 G. iHBECs were treated with 0 or 10 μg/ml anti-αvβ6 and ITGB6 mRNA was measured by QPCR at increasing time points. Data are expressed as mean expression relative to control (0 h) ± SEM from three independent experiments. ** p < 0.01, *** p < 0.005 H. iHBECs transfected with either pGL3-ITGB6 or empty pGL3 as a control were treated with 0 or 10 μg/ml anti-αvβ6 for 4 hours. Data are expressed as mean relative firefly / renilla luciferase ratio ± SEM from three independent experiments. * p < 0.05 I. iHBECs were pre-treated with no antibody (black bars), 10 μg/ml anti-TGFβ (checked bars) or 10 μg/ml anti-αvβ6 (white bars) for one hour then stimulated with 20 μM LPA. ITGB6 mRNA was measured by QPCR after 0 and 8 hours. Data are expressed as mean expression relative to control (0 h, no antibody) ± SEM from three independent experiments. * p < 0.05, ** p < 0.01 J. iHBECs were treated with 20μM LPA and PAI mRNA was measured by QPCR at 0, 2, 4 and 8 hours. Data are expressed as mean expression relative to control (0 h) ± SEM from three independent experiments. * p < 0.05.
Fig 3
Fig 3
A. SAECs were treated with 10 μM Alk5 inhibitor (SB431542) and ITGB6 mRNA was measured by QPCR at increasing time points. Data are expressed as mean expression relative to control (0 h) ± SEM from three independent experiments. * p < 0.05, ** p < 0.01 B. SAECS were treated with 10 μg/ml anti-TGFβ or an isotype control and αvβ6 cell surface expression measured by flow cytometry after three days. Three independent experiments were performed and the histogram shows representative data from one experimental repeat. Grey = negative control, black solid = isotype control, black dotted = anti-TGFβ. C. Amalgamated data from three independent experimental repeats of the experiment described in Fig 3B are demonstrated as a bar chart showing mean fold change in MFI ± SEM. D. SAECs were treated with 10 μM Alk5 inhibitor (SB431542), or an equivalent volume of the vehicle DMSO as a control, and αvβ6 cell surface expression measured by flow cytometry after three days. Three independent experiments were performed and the histogram shows representative data from one experimental repeat. Grey = negative control, black solid = DMSO control, black dotted = SB431542. E. Amalgamated data from three independent experimental repeats of the experiment described in Fig 3D are demonstrated as a bar chart showing mean fold change in MFI ± SEM. ** p < 0.01.
Fig 4
Fig 4
A. Schematic diagram showing the location of canonical Smad binding sites (CAGA) in the 1.1kb pGL3-ITGB6 promoter reporter construct. B. iHBECs transfected with either empty pCMV vector, dnSmad2 or dnSmad3 together with the pGL3-ITGB6 promoter reporter construct were treated with either 0 or 2 ng/ml TGFβ1 for 4 hours and luciferase activity measured. Data are expressed as mean fold change firefly / renilla luciferase (relative to pCMV, 0 ng/ml) ± SEM from three independent experiments. * p < 0.05, *** p < 0.005, **** p < 0.0001 C. iHBECs transfected with either empty pCMV vector or dnSmad4 together with the pGL3-ITGB6 promoter reporter construct were treated with either 0 or 2 ng/ml TGFβ1 for 4 hours and luciferase activity measured. Data are expressed as mean fold change firefly / renilla luciferase (relative to pCMV, 0 ng/ml) ± SEM from three independent experiments. * p < 0.05 D. iHBECs were transfected with either the unmutated pGL3-ITGB6 promoter reporter construct, or constructs containing mutations in key Smad binding sites at -884, -866 and -798 then treated with 0 or 2 ng/ml TGFβ1 for 4 hours. Luciferase activity was then measured. Data are expressed as mean fold change firefly / renilla luciferase (relative to pGL3-ITGB6, 0 ng/ml) ± SEM from three independent experiments.
Fig 5
Fig 5
A. iHBECs were treated with 2 ng/ml TGFβ1 and binding of Smad3 to the ITGB6 promoter at approximately -936 to -755 was assessed after 0, 0.5, 1 and 2 hours using ChIP. Data are expressed as mean relative binding (relative to 0 h) ± SEM from 3 independent experiments. B. iHBECs were treated with 2 ng/ml TGFβ1 and binding of Smad3 to the ITGB6 promoter at approximately -1608 to -1500 was assessed after 0, 0.5, 1 and 2 hours using ChIP. Data are expressed as mean relative binding (relative to 0 h) ± SEM from 3 independent experiments. C. iHBECs were treated with 2 ng/ml TGFβ1 and binding of Smad4 to the ITGB6 promoter at approximately -936 to -755 was assessed after 0, 0.5, 1 and 2 hours using ChIP. Data are expressed as mean relative binding (relative to 0 h) ± SEM from 3 independent experiments. D. iHBECs were treated with 2 ng/ml TGFβ1 and binding of Smad4 to the ITGB6 promoter at approximately -1608 to -1500 was assessed after 0, 0.5, 1 and 2 hours using ChIP. Data are expressed as mean relative binding (relative to 0 h) ± SEM from 3 independent experiments. E. iHBECs were treated with 2 ng/ml TGFβ1 and binding of Smad2 to the ITGB6 promoter at approximately -936 to -755 was assessed after 0, 0.5, 1 and 2 hours using ChIP. Data are expressed as mean relative binding (relative to 0 h) ± SEM from 3 independent experiments. F. iHBECs were treated with 2 ng/ml TGFβ1 and binding of Smad2 to the ITGB6 promoter at approximately -1608 to -1500 was assessed after 0, 0.5, 1 and 2 hours using ChIP. Data are expressed as mean relative binding (relative to 0 h) ± SEM from 3 independent experiments.
Fig 6
Fig 6
A. Rats were treated with a control adenovirus for 21 days and lung tissue was stained by immunohistochemistry for αvβ6 integrins. Figure is representative of n = 3 animals. B. Rats were treated with a TGFβ1 over-expression adenovirus for 21 days and lung tissue was stained by immunohistochemistry for αvβ6 integrins. Figure is representative of n = 3 animals. C. Smad3+/+ control animals were treated with a TGFβ1 over-expression adenovirus for 21 days and lung tissue was stained by immunohistochemistry for αvβ6 integrins. Figure is representative of n = 5 animals D. Smad3-/- control animals were treated with a TGFβ1 over-expression adenovirus for 21 days and lung tissue was stained by immunohistochemistry for αvβ6 integrins. Figure is representative of n = 4 animals E. αvβ6 immunohistochemistry described in Fig 5C and 5D was quantified using in a blind manner using a semi-quantitative, user-dependent method. Data are expressed as % of αvβ6 positive alveolar epithelium. Bars show mean ± SD F. Human lung tissue from pulmonary fibrosis donors (n = 10) and non-fibrotic controls (n = 9) was subjected to ChIP analysis to determine basal levels of Smad3 binding to the endogenous ITGB6 promoter in the region -936 to -755 from the transcription start site. Data are expressed as relative binding to the ITGB6 promoter (relative to IgG levels in each donor sample) and the median shown. Relative binding of 1 or below demonstrates no binding of Smad3 above IgG control levels. G. Relative binding of Smad3 measured in Fig 5F was correlated with measured levels of ITGB6 mRNA in each donor sample using linear regression analysis. R2 = 0.44, p = 0.019.

Similar articles

Cited by

References

    1. Navaratnam V, Fleming KM, West J, Smith CJ, Jenkins RG, Fogarty A, et al. The rising incidence of idiopathic pulmonary fibrosis in the U.K. Thorax. 2011;66(6):462–7. Epub 2011/04/29. 10.1136/thx.2010.148031 . - DOI - PubMed
    1. Vancheri C, Failla M, Crimi N, Raghu G. Idiopathic pulmonary fibrosis: a disease with similarities and links to cancer biology. Eur Respir J. 2010;35(3):496–504. Epub 2010/03/02. 10.1183/09031936.00077309 . - DOI - PubMed
    1. Tatler AL, Jenkins G. TGF-beta activation and lung fibrosis. Proceedings of the American Thoracic Society. 2012;9(3):130–6. Epub 2012/07/18. 10.1513/pats.201201-003AW . - DOI - PubMed
    1. Yang Z, Mu Z, Dabovic B, Jurukovski V, Yu D, Sung J, et al. Absence of integrin-mediated TGFbeta1 activation in vivo recapitulates the phenotype of TGFbeta1-null mice. The Journal of cell biology. 2007;176(6):787–93. . - PMC - PubMed
    1. Henderson NC, Arnold TD, Katamura Y, Giacomini MM, Rodriguez JD, McCarty JH, et al. Targeting of alphav integrin identifies a core molecular pathway that regulates fibrosis in several organs. Nature medicine. 2013;19(12):1617–24. Epub 2013/11/13. 10.1038/nm.3282 - DOI - PMC - PubMed

MeSH terms