

Neonatal Fc Receptor Regulation of Lung Immunoglobulin and CD103+ Dendritic Cells Confers Transient Susceptibility to Tuberculosis
- PMID: 27481246
- PMCID: PMC5038074
- DOI: 10.1128/IAI.00533-16
Neonatal Fc Receptor Regulation of Lung Immunoglobulin and CD103+ Dendritic Cells Confers Transient Susceptibility to Tuberculosis
Abstract
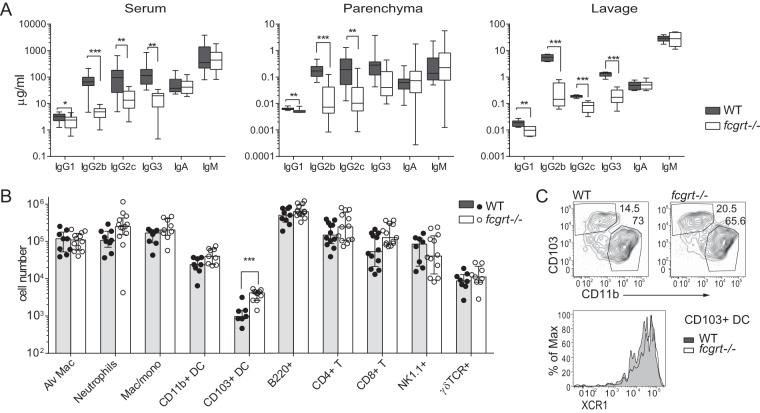
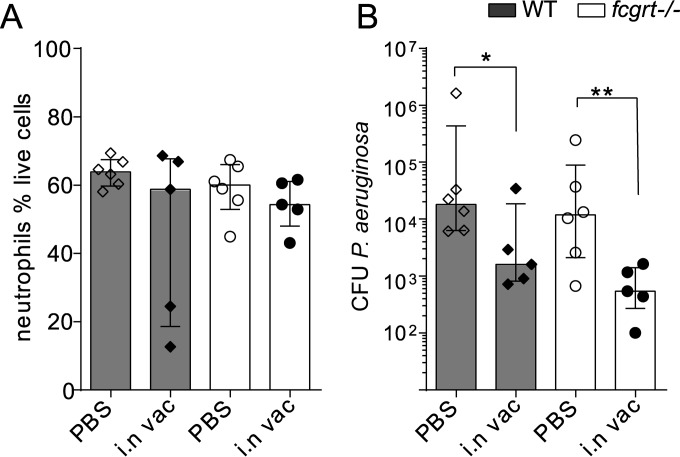
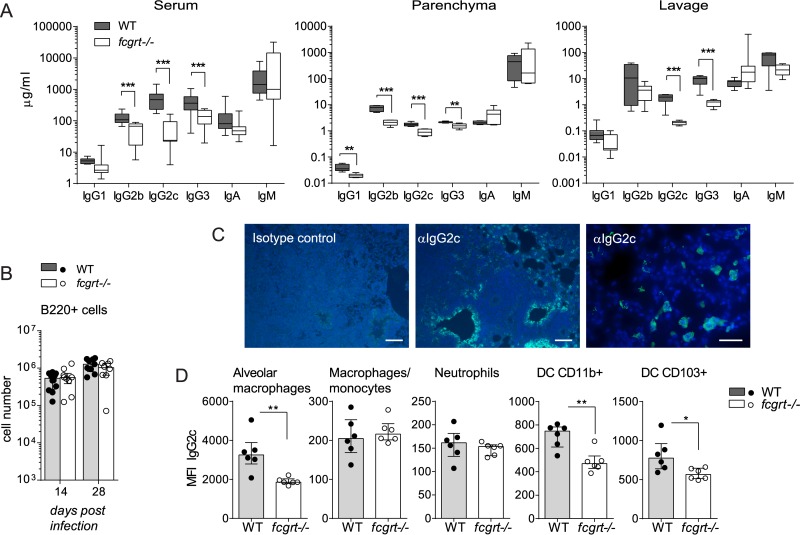
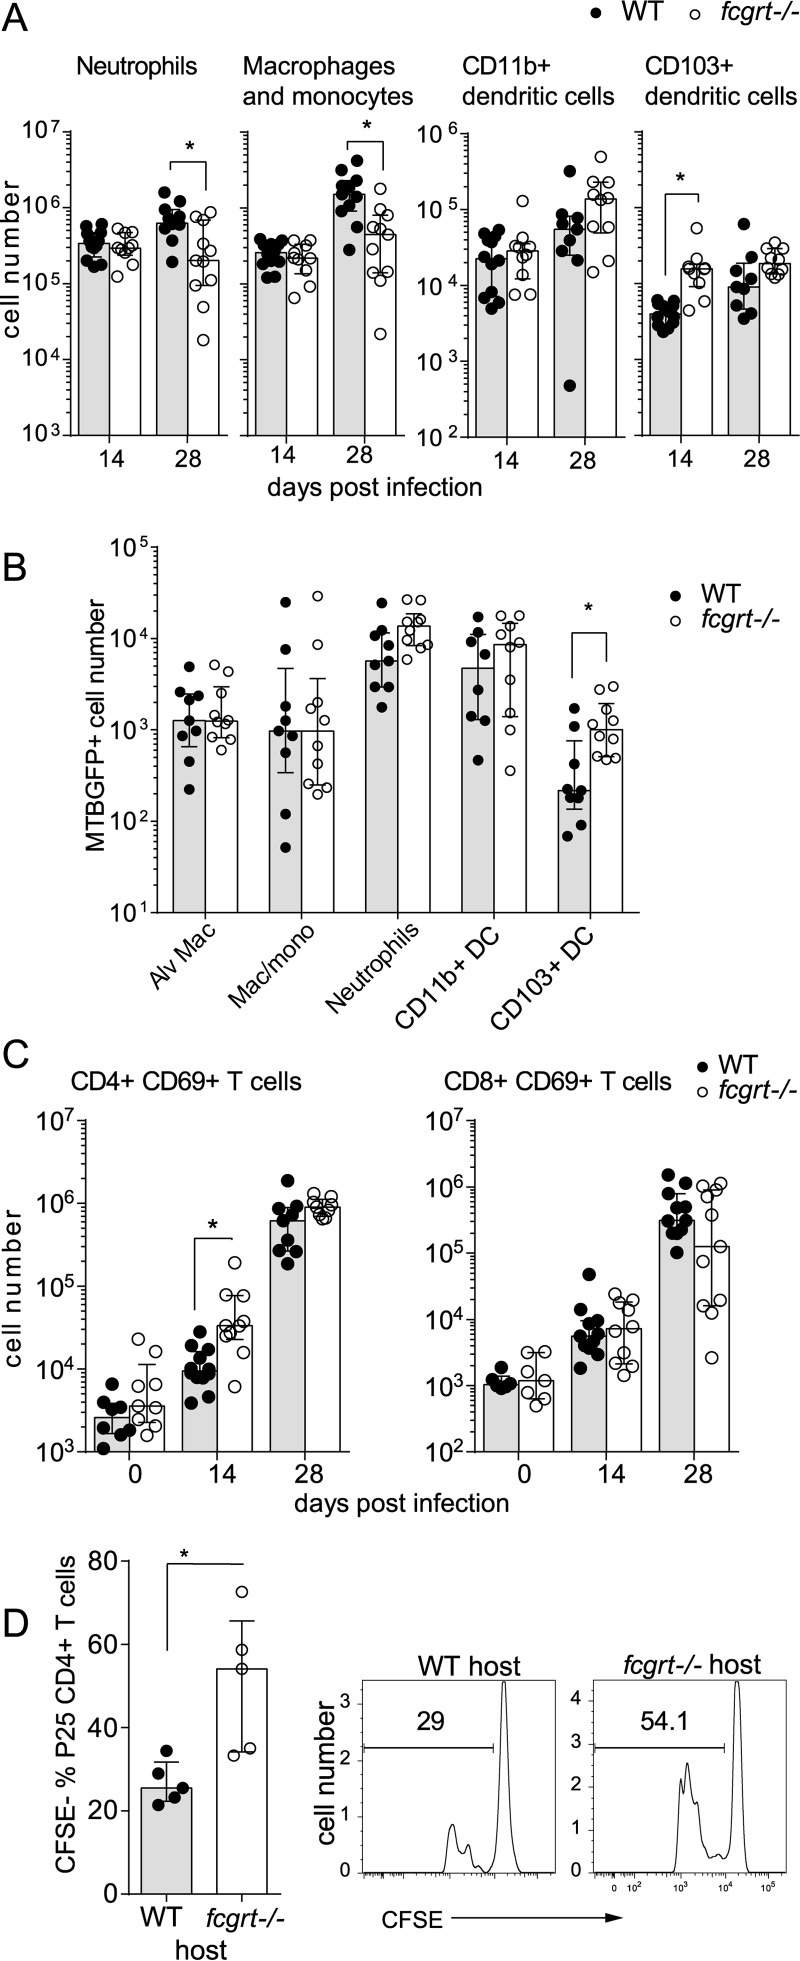
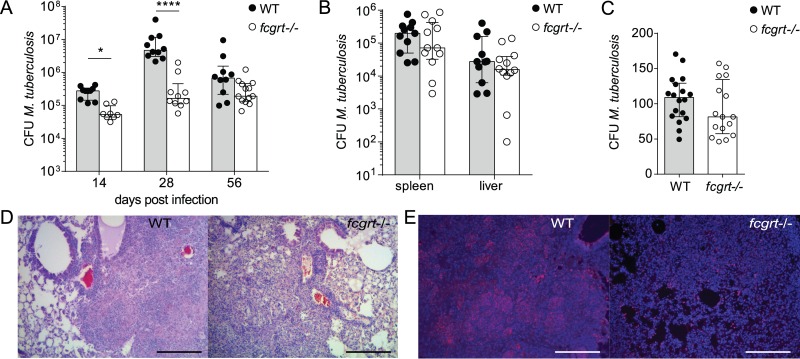
The neonatal Fc receptor (FcRn) extends the systemic half-life of IgG antibodies by chaperoning bound Fc away from lysosomal degradation inside stromal and hematopoietic cells. FcRn also transports IgG across mucosal barriers into the lumen, and yet little is known about how FcRn modulates immunity in the lung during homeostasis or infection. We infected wild-type (WT) and FcRn-deficient (fcgrt(-/-)) mice with Pseudomonas aeruginosa or Mycobacterium tuberculosis to investigate whether recycling and transport of IgG via FcRn influences innate and adaptive immunity in the lung in response to bacterial infection. We found that FcRn expression maintains homeostatic IgG levels in lung and leads to preferential secretion of low-affinity IgG ligands into the lumen. Fcgrt(-/-) animals exhibited no evidence of developmental impairment of innate immunity in the lung and were able to efficiently recruit neutrophils in a model of acute bacterial pneumonia. Although local humoral immunity in lung increased independently of the presence of FcRn during tuberculosis, there was nonetheless a strong impact of FcRn deficiency on local adaptive immunity. We show that the quantity and quality of IgG in airways, as well as the abundance of dendritic cells in the lung, are maintained by FcRn. FcRn ablation transiently enhanced local T cell immunity and neutrophil recruitment during tuberculosis, leading to a lower bacterial burden in lung. This novel understanding of tissue-specific modulation of mucosal IgG isotypes in the lung by FcRn sheds light on the role of mucosal IgG in immune responses in the lung during homeostasis and bacterial disease.
Copyright © 2016 Vogelzang et al.
Figures

Similar articles
-
The Neonatal Fc Receptor (FcRn): A Misnomer?Front Immunol. 2019 Jul 10;10:1540. doi: 10.3389/fimmu.2019.01540. eCollection 2019. Front Immunol. 2019. PMID: 31354709 Free PMC article. Review.
-
FcRn: from molecular interactions to regulation of IgG pharmacokinetics and functions.Curr Top Microbiol Immunol. 2014;382:249-72. doi: 10.1007/978-3-319-07911-0_12. Curr Top Microbiol Immunol. 2014. PMID: 25116104 Review.
-
Receptor-mediated immunoglobulin G transport across mucosal barriers in adult life: functional expression of FcRn in the mammalian lung.J Exp Med. 2002 Aug 5;196(3):303-10. doi: 10.1084/jem.20020400. J Exp Med. 2002. PMID: 12163559 Free PMC article.
-
Neonatal FcR overexpression boosts humoral immune response in transgenic mice.J Immunol. 2011 Jan 15;186(2):959-68. doi: 10.4049/jimmunol.1000353. Epub 2010 Dec 8. J Immunol. 2011. PMID: 21148035
-
MHC class I-related neonatal Fc receptor for IgG is functionally expressed in monocytes, intestinal macrophages, and dendritic cells.J Immunol. 2001 Mar 1;166(5):3266-76. doi: 10.4049/jimmunol.166.5.3266. J Immunol. 2001. PMID: 11207281 Free PMC article.
Cited by
-
Analysis of Beyfortus® (Nirsevimab) Immunization Campaign: Effectiveness, Biases, and ADE Risks in RSV Prevention.Curr Issues Mol Biol. 2024 Sep 18;46(9):10369-10395. doi: 10.3390/cimb46090617. Curr Issues Mol Biol. 2024. PMID: 39329969 Free PMC article. Review.
-
The Neonatal Fc Receptor (FcRn): A Misnomer?Front Immunol. 2019 Jul 10;10:1540. doi: 10.3389/fimmu.2019.01540. eCollection 2019. Front Immunol. 2019. PMID: 31354709 Free PMC article. Review.
-
Leveraging Antibody, B Cell and Fc Receptor Interactions to Understand Heterogeneous Immune Responses in Tuberculosis.Front Immunol. 2022 Mar 17;13:830482. doi: 10.3389/fimmu.2022.830482. eCollection 2022. Front Immunol. 2022. PMID: 35371092 Free PMC article. Review.
-
Factors Affecting the FcRn-Mediated Transplacental Transfer of Antibodies and Implications for Vaccination in Pregnancy.Front Immunol. 2017 Oct 13;8:1294. doi: 10.3389/fimmu.2017.01294. eCollection 2017. Front Immunol. 2017. PMID: 29163461 Free PMC article. Review.
-
Albumin fusion with granulocyte-macrophage colony-stimulating factor acts as an immunotherapy against chronic tuberculosis.Cell Mol Immunol. 2021 Oct;18(10):2393-2401. doi: 10.1038/s41423-020-0439-2. Epub 2020 May 7. Cell Mol Immunol. 2021. PMID: 32382128 Free PMC article.
References
-
- Yoshida M, Kobayashi K, Kuo TT, Bry L, Glickman JN, Claypool SM, Kaser A, Nagaishi T, Higgins DE, Mizoguchi E, Wakatsuki Y, Roopenian DC, Mizoguchi A, Lencer WI, Blumberg RS. 2006. Neonatal Fc receptor for IgG regulates mucosal immune responses to luminal bacteria. J Clin Invest 116:2142–2151. doi:10.1172/JCI27821. - DOI - PMC - PubMed
MeSH terms
Substances
LinkOut - more resources
Full Text Sources
Other Literature Sources
Medical
Research Materials
