. 2016 Aug 16;7(33):52643-52660.
doi: 10.18632/oncotarget.10769.

p53 elevation in human cells halt SV40 infection by inhibiting T-ag expression

Affiliations

p53 elevation in human cells halt SV40 infection by inhibiting T-ag expression

Nir Drayman et al. Oncotarget. .

Abstract

SV40 large T-antigen (T-ag) has been known for decades to inactivate the tumor suppressor p53 by sequestration and additional mechanisms. Our present study revealed that the struggle between p53 and T-ag begins very early in the infection cycle. We found that p53 is activated early after SV40 infection and defends the host against the infection. Using live cell imaging and single cell analyses we found that p53 dynamics are variable among individual cells, with only a subset of cells activating p53 immediately after SV40 infection. This cell-to-cell variabilty had clear consequences on the outcome of the infection. None of the cells with elevated p53 at the beginning of the infection proceeded to express T-ag, suggesting a p53-dependent decision between abortive and productive infection. In addition, we show that artificial elevation of p53 levels prior to the infection reduces infection efficiency, supporting a role for p53 in defending against SV40. We further found that the p53-mediated host defense mechanism against SV40 is not facilitated by apoptosis nor via interferon-stimulated genes. Instead p53 binds to the viral DNA at the T-ag promoter region, prevents its transcriptional activation by Sp1, and halts the progress of the infection. These findings shed new light on the long studied struggle between SV40 T-ag and p53, as developed during virus-host coevolution. Our studies indicate that the fate of SV40 infection is determined as soon as the viral DNA enters the nucleus, before the onset of viral gene expression.

Keywords: SV40; Sp1; host defense; large T-antigen; p53.


Conflict of interest statement

The authors declare no conflict of interests.

Figures
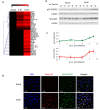
Figure 1
Figure 1. SV40 infection triggers activation of p53
A. Serine-phosphorylation of 29 proteins annotated to participate in DNA-damage signaling was probed in mock-infected and SV40-infected (moi 10) CV-1 cells using antibody arrays [39]. Red colors indicate increased phosphorylation compared to mock-infected cells. p53 is marked with a red arrow. B. Western blot analyses of whole cell lysates detecting total p53 and p53 phosphorylation at S392. C. Quantification of 3 independent infection experiments. The bands were quantified and the levels of total p53 and S392 bands were normalized to GAPDH. Since the level of total p53 increased also in the mock, presumably due to their approaching contact inhibition, we subtracted the values of the normalized bands of the 3 mock infections from their corresponding bands of SV40 infection. The same was done for S392 bands. The graph depicts average of 3 experiments; standard errors are represented by bars. D. Immuno-histochemistry of CV-1 cells. Cells were co-stained for total p53 and for p53 phosphorylated at S392, 9 hours post infection by SV40.
Figure 2
Figure 2. p53 functions in host defense against SV40
A. CV-1 cells were pre-treated with 20 μM Nutlin3 in 1% DMSO, or with 1% DMSO without Nutlin3, for 16 hours before infection. The western blot shows that Nutlin3 treatment dramatically increased p53 levels. At 24 hours post infection p53 is elevated in infected cells due to the infection and regardless of Nutlin3 treatment. B. SV40 infectivity following Nutlin3 pre-treatment in CV-1 cells. Cells treated as in panel A were infected at several moi's and the percentage of infected cells was determined 24 hours post adsorption by FACS staining of T-ag, as previously described [56]. Data points represent mean ± S.E. of three independent experiments. The decrease in infection of the Nutlin3 treated cells is statistically significant (p-value < 0.01, one-sample t-test). C. Western blot showing p53 level in p53-positive and negative MCF7 cells, harvested 24 hours post infection. As expected, there is no p53 in the negative cell-line. D. SV40 infectivity of the MCF7 cell lines. Cells were infected at several moi's and the percentage of T-ag positive cells was determined 24 hours post adsorption. The increase in infection of the p53 negative cell line is statistically significant (data points for 3 independent experiments; p-value < 0.01, one-sample t-test).
Figure 3
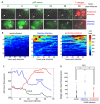
Figure 3. Dynamics of p53 in single cells following SV40 infection
MCF7 cells carrying a p53-venus fusion protein were infected at moi 30. Images were taken every 20 min for 48 hours, at which time the cells were fixed and stained for T-ag. The data represent tracked cells from 4 independent experiments A. Representative images of SV40-infected cells. p53-venus appears in green and T-ag staining in red. The upper panels show a productively infected cell (white arrow, T-ag positive at 48 hrs) at the indicated time points; the lower panels show abortive infection (white arrow). B. Heat-maps representing the dynamics of p53 fluorescence in individual cells. Data include 46 mock infected (left panel) and 117 SV40-infected, including 51 abortively infected (middle panel) and 66 productively infected MCF7 cells (right panel). Each row represents a single cell. Relative p53 level in each cell over time is evaluated by the level of Venus fluorescence. The data are color-coded, from blue (low levels) to red (high levels). Analyses of the data are presented in panels (C) and (D). C. Mean p53 level of each group of cells, in arbitrary units determined as mean fluorescence, is represented over time. See S3 Figure for zoom in on the data for the first 12 hours after infection. D. Mean fluorescence of individual cells, represented by small circles, during the first 12 hours of infection. p53 fluorescence in the mock and productively infected cells are similar (p-value = 0.99, two-tailed t-test). Abortively infected cells are clustered into two subgroups, with high and low p53 levels. p53 fluorescence of the abortively infected cells (both subgroups taken together) is significantly different from both mock and productively infected cells (p-value < 0.001, one-tailed t-test).
Figure 4
Figure 4. mRNA levels of the p53 target genes, p21 and Bax
Mock and SV40-infected cells were harvest at 6, 12 and 24 hrs post infection and RNA was extracted. mRNA levels of the p53-target genes that regulate cell cycle and apoptosis were analyzed by quantitative RT-PCR. The primers are listed in S1 Table. A.-B. CV-1 cells; C.-D. MCF7 cells. The figure presents averages and standard error of 3 independent experiments. Levels of both Bax and p21 were not significantly different between mock and SV40-infected cells in both cell lines (p-value > 0.05, two-tailed t-test).
Figure 5
Figure 5. The effect of p53 elevation on the cell-cycle of CV-1
CV-1 cells were treated for 16 hours with 20 μM Nutlin3 in 1% DMSO (colored red in Figure 5B) or with 1% DMSO without Nutlin3 (colored blue in Figure 5B). The cells were harvested by trypsinization and fixed with 70% ethanol overnight. For FACS analysis the cells were treated with RNAse and stained with Propidium Iodide.
Figure 6
Figure 6. Interferon stimulated genes are not induced in SV40 infected cells
Mock or SV40-infected cells were harvest at 6, 12 and 24 hrs post infection and RNA was extracted. mRNA levels of interferon stimulated genes were analyzed by quantitative RT-PCR. The primers are listed in S1 Table. A., B. CV-1 cells; C.-G. MCF7 cells. The figure presents averages and error bars of 3 independent experiments. The mRNA levels of all the tested genes were not significantly different between mock and SV40-infected cells (p-value >0.05, two-tailed t-test). The only exception was IRF9 at 12 hours, when the mock mRNA was slightly higher (p = 0.044) than that of the infected cells.
Figure 7
Figure 7. p53 binds to the SV40 early promoter, correlating with a decrease in T-ag mRNA
A. CV-1 cells, with or without 16 hours Nutlin3 pre-treatment, were infected with SV40 and the level of T-ag mRNA, represented as relative units, was measured by quantitative RT-PCR at the indicated time-points, with HPRT RNA as an internal standard. Note that the T-ag protein is seen at 9 hours post infection (Figure S4). The results shown are mean ± S.E. of 5 independent experiments. For the statistical analysis, we compared the area under the curves and found that it was significantly lower in Nutlin3 treated cells compared to untreated cells (680±50 AU vs. 1400±142 AU, respectively. p-value = 0.004). B. Diagram of the regulatory region of the SV40 genome presenting the ori - origin of replication, the GC-boxes and the Enhancer, composed of duplicated 72 bp. The 3 T-ag binding sites are shown on top, and DNA sequence of the GC-boxes with the overlapping Sp1 (red) and p53 (Blue) binding sites below (http://alggen.lsi.upc.es/cgi-bin/promo_v3/promo/promoinit.cgi?dirDB=TF_8.3). The green arrows designate the location of the PCR primers used in the ChIP experiments. C. Binding of Sp1, p53 and T-ag to SV40 DNA in vivo was determined by ChIP at the indicated time points. DNA recovered from the immune precipitate was quantified by PCR with SV40 DNA as an internal standard. Results are mean ± S.E. of 3 independent experiments.
Figure 8
Figure 8. Model for the mechanism of p53 host defense against SV40 infection
A. Cells infected by SV40 have variable levels of p53, due to sporadic spontaneous pulses of the protein as was previously reported. Cells with higher levels of p53 are primed toward its activation after the infection (cell on the left). Sp1 is presumed to be present in all cells. B. Activation of p53 start around 3 hours post infection, preferably in cells in which the protein is already above steady state level. C. Nuclear entry at 8-9 hours. The active p53 (left cell) captures the DNA and inhibits SV40 gene expression. In the absence of active p53 (right cell) T-ag is expressed and the viral DNA replicates. D. Virion particles are produced only in the right cell. Our model proposes that the decision between abortive vs productive infection occurs upon nuclear entry of the viral DNA.

Similar articles

Cited by

References

    1. Lane DP, Crawford LV. T antigen is bound to a host protein in SV40-transformed cells. Nature. 1979;278:261–263. - PubMed
    1. Linzer DI, Levine AJ. Characterization of a 54K dalton cellular SV40 tumor antigen present in SV40-transformed cells and uninfected embryonal carcinoma cells. Cell. 1979;17:43–52. - PubMed
    1. Levine AJ. The p53 tumor suppressor gene and gene product. Princess Takamatsu symposia. 1989;20:221–230. - PubMed
    1. Stanbridge EJ. The evidence for human tumor suppressor genes. Princess Takamatsu symposia. 1989;20:3–13. - PubMed
    1. Lane DP. Cancer. p53, guardian of the genome. Nature. 1992;358:15–16. - PubMed

MeSH terms

Substances