. 2016 Aug 4;536(7614):104-7.
doi: 10.1038/nature18966. Epub 2016 Jul 27.

Structure of the adenosine A(2A) receptor bound to an engineered G protein

Structure of the adenosine A(2A) receptor bound to an engineered G protein

Byron Carpenter et al. Nature. .

Erratum in

Abstract

G-protein-coupled receptors (GPCRs) are essential components of the signalling network throughout the body. To understand the molecular mechanism of G-protein-mediated signalling, solved structures of receptors in inactive conformations and in the active conformation coupled to a G protein are necessary. Here we present the structure of the adenosine A(2A) receptor (A(2A)R) bound to an engineered G protein, mini-Gs, at 3.4 Å resolution. Mini-Gs binds to A(2A)R through an extensive interface (1,048 Å2) that is similar, but not identical, to the interface between Gs and the β2-adrenergic receptor. The transition of the receptor from an agonist-bound active-intermediate state to an active G-protein-bound state is characterized by a 14 Å shift of the cytoplasmic end of transmembrane helix 6 (H6) away from the receptor core, slight changes in the positions of the cytoplasmic ends of H5 and H7 and rotamer changes of the amino acid side chains Arg3.50, Tyr5.58 and Tyr7.53. There are no substantial differences in the extracellular half of the receptor around the ligand binding pocket. The A(2A)R-mini-Gs structure highlights both the diversity and similarity in G-protein coupling to GPCRs and hints at the potential complexity of the molecular basis for G-protein specificity.


Figures

Extended Data Figure 1
Pharmacological analyses of A2AR–mini-Gs complexes. Competition assays were performed on A2AR expressed in HEK293 cell membranes with the agonist NECA competing for the binding of radiolabelled inverse agonist 3H-ZM241385. Experiments were performed in the presence of either 100 mM KCl (a,b), 100 mM NaCl (c, d) or 500 mM NaCl (e, f) to confirm the similar behaviour of mini-Gs with heterotrimeric Gs with nanobody Nb35 for stabilisation of the complex. Results are summarised in the Table (g). Data from at least 3 independent experiments performed in duplicate were analysed with an unpaired t-test for statistical significance.
Extended Data Figure 2
Thermostability of detergent-solubilised 3H-NECA-bound A2AR in the presence or absence of mini-Gs. Unpurified A2AR was solubilised in detergent at the following concentrations: a, DDM, 0.1%; b, DM, 0.13%; c, OG, 0.8%. Samples were heated for 30 minutes, quenched on ice and the amount of 3H-NECA bound determined. Data were analysed by non-linear regression and apparent Tm values were determined from analysis of the sigmoidal dose-response curves fitted (d). Results represent the mean ± SEM of two independent experiments, performed in duplicate.
Extended Data Figure 3
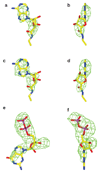
Omit maps for NECA and GDP. Orthogonal views of omit map difference density for NECA in A2AR chain A (a, b), NECA in A2AR chain B (c, d) and GDP in mini-Gs chain C (e, f). The contour level is 2.5 sigma in panels a-d and 3.0 sigma in panels e and f. Figures were made using CCP4mg.
Extended Data Figure 4
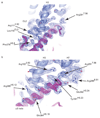
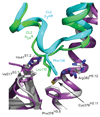
Electron density for the interface region of the A2AR–mini Gs complex. The backbones of A2AR and mini-Gs are shown in cartoon representation in light blue and magenta respectively. Side chains are shown in stick representation (carbon, light blue; oxygen, red; nitrogen, deep blue). The electron density of the final 2Fo-Fc map is shown contoured at 1.2 sigma. For clarity, transmembrane helices H5 and H6 and the corresponding electron density have been omitted. (a) View showing the interaction between the C-terminal helix of mini-Gs and the CL2 loop of A2AR. (b) View showing the interactions between side chains of the C-terminal helix of mini-Gs and three Arg residues of A2AR.
Extended Data Figure 5
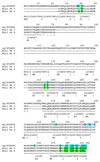
Alignment of mini-Gs with GNAS2. Comparison of amino acid residues in mini-Gs (chains C & D) within 3.9 Å of A2AR (green) in the A2AR–mini-Gs structure and the amino acid residues in bovine GNAS2 (P04896) within 3.9 Å of β2AR in the β2AR–Gs structure (turquoise). The CGN system is used for reference.
Extended Data Figure 6
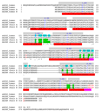
Alignment of β2AR and A2AR amino acid sequences. adrb2_human, human β2-adrenergic receptor; AA2AR_human, human adenosine A2A receptor; AA2AR chain A, chain A of the crystallised A2AR–mini-Gs structure; AA2AR chain B, chain B of the crystallised A2AR–mini-Gs structure. Residues in the receptors that are within 3.9 Å of either Gσ in the β2AR–Gs complex or mini-Gs in the A2AR–mini-Gs complex are highlighted in turquoise or green, respectively. Key Ballesteros-Weinstein numbers are shown in blue and mutations in the crystallised A2AR to facilitate purification and crystallization are shown in red. Grey bars indicate the positions of α-helices in the β2AR–Gs structure, whereas red bars represent these regions in the A2AR–mini-Gs structure; where there is a discrepancy in helix length between Chain A and B of A2AR, the bar is coloured pink.
Extended Data Figure 7
A conserved hydrophobic binding pocket at the receptor-Gασ interface. The A2AR–mini-Gs complex was aligned to the β2AR–Gs complex via the receptors; A2AR, green; β2AR, turquoise; mini-Gs (purple); Gαs (grey).
Extended Data Figure 8
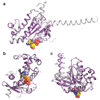
Comparison between receptor-bound mini-Gs and Gασ. a-c, Three different views of an alignment of mini-Gs (chain C, purple) bound to A2AR with the GTPase domain of Gαs (grey) bound to β2AR. GDP bound to mini-Gs is depicted as a space filling model (carbon, yellow; oxygen, red; nitrogen, blue; phosphorus, orange). The α5 helix that interacts with the receptors is labelled.
Extended Data Figure 9
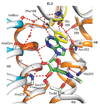
Comparison of the NECA binding site in the active-intermediate state compared to the mini-Gs-bound state. The structure of NECA-bound A2AR (grey cartoon, with the carbon atoms of NECA also in grey) in the active-intermediate state was aligned with the structure of the NECA-bound A2AR–mini-Gs complex (rainbow colouration, with the carbon atoms of NECA in green). Key amino acid residues for both receptors are depicted (sticks; carbon atoms in the same colour as the respective receptor) that form hydrogen bonds (red dashed line) with either NECA or the associated water network (red spheres). Note that the water molecules depicted are from only the NECA-bound A2AR structure in the active-intermediate state, because the resolution of the A2AR–mini-Gs structure was insufficient to identify water molecules. Carbonyl oxygens are denoted by ‘co’ after the residue name.
Figure 1
Figure 1
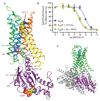
Ligand binding and overall structure of the A2AR–mini-Gs complex. a, The structure of A2AR is depicted as a cartoon in rainbow coloration (N-terminus in blue, C-terminus in red) with mini-Gs in purple. The agonist NECA bound to A2AR and GDP bound to mini-Gs are depicted as space-filling models (carbon, yellow; nitrogen, blue; oxygen, red; phosphorous, orange). Relevant secondary structural features are labelled. b, Mini-Gs increases the affinity of agonist binding to A2AR similar to that observed by a heterotrimeric G protein. Competition binding curves were performed in duplicate (n = 3) by measuring the displacement of the inverse agonist 3H-ZM241385 with increasing concentrations of the agonist NECA (Ki values in parentheses, see Extended Data Fig. 1 for full data): blue circles, A2AR (Ki 4.6 ± 0.3 μM); orange squares, A2AR and mini-Gs (Ki 430 ± 80 nM); green diamonds, A2AR and heterotrimeric G protein with nanobody Nb35 (Ki 340 ± 70 nM). G proteins were all added to membranes containing A2AR to give a final concentration of 25 μM and the final concentration of NaCl was 100 mM (see Methods online). c, The structure of β2AR (green) bound to Gs (grey and purple) is depicted as a cartoon in the same orientation as A2AR in a; the purple region in Gs corresponds to the structure of mini-Gs.
Figure 2
Figure 2
Packing interactions between A2AR and mini-Gs. a, Diagram of A2AR depicting its secondary structure in the A2AR–mini-Gs structure. Residues shaded in grey are disordered in either chain A and/or chain B. Disulphide bonds are depicted as pink lines. b, Cartoon of the mini-Gs topology. c, Diagram of contacts between mini-Gs and A2AR, with line thickness representing the relative number of interactions between amino acid residues. In all panels, amino acid residues depicted in colour are at the interface between mini-Gs and A2AR (within 3.9 Å), with colours reflecting the properties of the side chain; blue, positively charged; red; negatively charged; green, hydrophobic; yellow, hydrophilic.
Figure 3
Figure 3
Comparison of the A2AR–mini-Gs and β2AR–Gs complexes. a, Structural alignment of β2AR–Gs (PDB ID: 3SN6) and A2AR–mini-Gs was performed by aligning the receptors alone; A2AR, rainbow colouration; β2AR, grey. The resultant relative dispositions of Gαs (dark grey) bound to β2AR and mini-Gs bound to A2AR (purple) are depicted. NECA and GDP are depicted as space-filling models (carbon, yellow; nitrogen, blue; oxygen, red; phosphorous, orange). The α-helical domain of Gαs, Gβγ and Nb35 have all been omitted for clarity. b-e, Detailed comparisons of hydrogen bonds (red dashed lines) between the respective G proteins and receptors; both receptors are in rainbow colouration, with mini-Gs in purple and Gαs in grey. Labelling of amino acid residues shows the Ballesteros-Weinstein (B-W) numbers for the receptors and the CGN notation for G proteins. f and g, Views of the cytoplasmic surface of A2AR and β2AR, respectively, as space-filling models with atoms making contacts with their respective G proteins coloured according to their type; carbon, green; nitrogen, blue; oxygen, red. Atoms coloured pink comprise conserved hydrophobic residues in the core of the receptors against which Arg3.50 packs. h, Comparison of residues making contacts to G proteins in the A2AR–mini-Gs complex and the β2AR–Gs complex. Amino acid residues in the receptors that make contacts are coloured: red, negatively charged; blue, positively charged; green, hydrophobic; yellow, hydrophilic. Residues in white are those that do not make contact to the respective G protein, but the equivalent residue in the other receptor does. B-W numbers are given for residues in transmembrane α-helices, with a dash for residues in loops or H8. Amino acid residues 5.71-5.77 are disordered in the A2AR–mini-Gs structure.
Figure 4
Figure 4
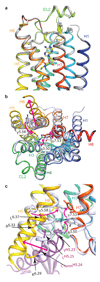
Conformational changes in A2AR upon G protein binding. A2AR (rainbow colouration) bound to mini-Gs (purple) was aligned with A2AR in the active-intermediate conformation bound to either NECA (PDB ID: 2YDV) or UK432097 (PDB ID: 3QAK) to highlight structural changes upon G protein binding. Neither structure was used for both comparisons because the large extensions of the ligand UK432097 compared to NECA distorts the extracellular surface in comparison to the NECA-bound structure and the NECA-bound structure contains a thermostabilising mutation in the intracellular half of the receptor. a, Alignment between 2YDV and the extracellular half of the A2AR–mini-Gs complex is viewed parallel to the membrane plane. b, Alignment with 3QAK and viewed from the cytoplasmic surface with mini-Gs removed for clarity. c, Alignment with 3QAK viewed parallel to the membrane with the cytoplasmic side at the bottom. Residues are labelled with their Ballesteros-Weinstein numbers and arrows depict the direction of movement upon mini-Gs binding. Conversion of B-W and CGN numbers to amino acid residues in A2AR and mini-Gs, respectively, are as follows: R3.50, Arg102; Y5.58, Tyr197; K6.29, Lys227; A6.33, Ala231 carbonyl; L6.37, Leu235; Y7.53, Tyr288; YH5.23, Tyr391; LH5.25, Leu393; C-termH5.26, C-terminus of mini-Gs (Leu394). The receptor is in rainbow colours and the mini-Gs is in purple.

Similar articles

Cited by

References

    1. Kobilka BK. Structural insights into adrenergic receptor function and pharmacology. Trends Pharmacol Sci. 2011;32:213–218. - PMC - PubMed
    1. Venkatakrishnan AJ, et al. Molecular signatures of G-protein-coupled receptors. Nature. 2013;494:185–194. - PubMed
    1. Carpenter B, Tate CG. Engineering a minimal G Protein to facilitate crystallisation of G protein coupled receptors in their active conformation. 2016 Submitted. - PMC - PubMed
    1. Rasmussen SG, et al. Crystal structure of the beta2 adrenergic receptor-Gs protein complex. Nature. 2011;477:549–555. - PMC - PubMed
    1. Lebon G, et al. Agonist-bound adenosine A2A receptor structures reveal common features of GPCR activation. Nature. 2011;474:521–525. - PMC - PubMed

Publication types

MeSH terms

Substances