. 2016 Jul 27:7:12248.
doi: 10.1038/ncomms12248.

A single-molecule view of transcription reveals convoys of RNA polymerases and multi-scale bursting

Affiliations

A single-molecule view of transcription reveals convoys of RNA polymerases and multi-scale bursting

Katjana Tantale et al. Nat Commun. .

Abstract

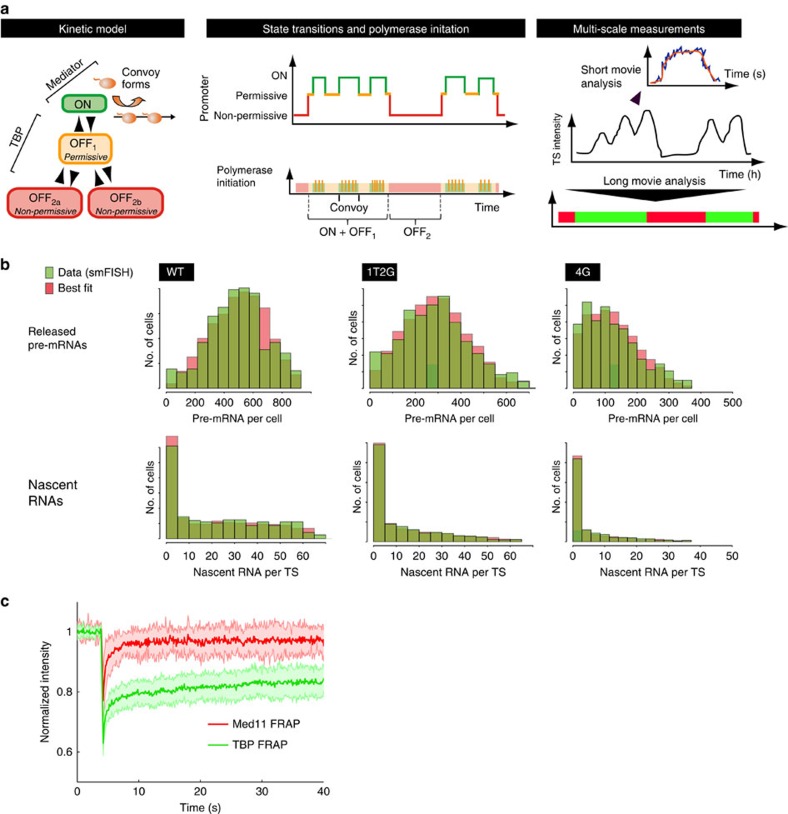
Live-cell imaging has revealed unexpected features of gene expression. Here using improved single-molecule RNA microscopy, we show that synthesis of HIV-1 RNA is achieved by groups of closely spaced polymerases, termed convoys, as opposed to single isolated enzymes. Convoys arise by a Mediator-dependent reinitiation mechanism, which generates a transient but rapid succession of polymerases initiating and escaping the promoter. During elongation, polymerases are spaced by few hundred nucleotides, and physical modelling suggests that DNA torsional stress may maintain polymerase spacing. We additionally observe that the HIV-1 promoter displays stochastic fluctuations on two time scales, which we refer to as multi-scale bursting. Each time scale is regulated independently: Mediator controls minute-scale fluctuation (convoys), while TBP-TATA-box interaction controls sub-hour fluctuations (long permissive/non-permissive periods). A cellular promoter also produces polymerase convoys and displays multi-scale bursting. We propose that slow, TBP-dependent fluctuations are important for phenotypic variability of single cells.


Figures

Figure 1
Figure 1. Characterization of the MS2x128 RNA tag.
(a) Generation of the MS2x128 RNA tag. (b) Schematic of the HIV-1 reporter construct. The green squares represent the MS2 repeat; the green oval, MCP-GFP; the orange ball, RNAPII with the nascent RNAs. LTR: the HIV-1 long terminal repeat; SD1: the major HIV-1 splice donor; SA7: the last splice acceptor; Ψ: packaging sequence; RRE: Rev-responsive element. (c) Comparison of the MS2 × 24 and MS2 × 128 tags. Images are selected planes from an epifluorescence 4D stack and show cells expressing the MS2-tagged reporter genes. Excitation power was set to obtain comparable signal-to-noise ratios (SNR) for the two reporters in the first image stack. SNR is the mean signal of single molecules divided by the s.d. of the background. Top right panel: a calibration stack was recorded at the movie end with a higher excitation power (see Methods section). All images were rescaled to display similar intensities for single molecules. Red arrows: individual RNA molecules. Blue arrow: transcription site (TS). Signal saturation is due to rescaling. Inset: intensity line profile through single-molecule spots. Scale bar, 5 μm. (d) SNR of single RNA molecules. Plot shows mean values and standard deviations of SNR of single RNA molecules in the first frame of movies, for the MS2 × 24 and MS2 × 128 tags (6 cells; >500 single RNA molecules). (e) Bleaching of MCP-GFP. Graph shows normalized intensity of nucleoplasmic MCP-GFP as a function of the frame number (mean and s.d.). Intensities were averaged over the nucleoplasm and normalized to the first frame (five cells). (f) Intensities of single RNA molecules. Graph shows estimated amplitude of 3D Gaussians that fit isolated RNA molecules (mean and s.d.), after normalization to the first frame (five cells; >500 single molecules). Reliable fits could no longer be obtained after 80 stacks for MS2 × 24.
Figure 2
Figure 2. Kinetic parameters of HIV-1 polymerase convoys in High Tat cells.
(a,b) TS intensities over time. In a, x axis is time in s and y axis is the intensity of TS, expressed in equivalent number of full-length RNA molecules. In b, each lane is a cell and the TS intensity is colour coded (scale on the right). (c) Transcription by polymerase convoys. Top schematic of a polymerase convoy. Npol: number of polymerase; tspace: RNAPII spacing (in s); vel: elongation rate. Bottom and right: schematics describing the different phases of a transcription cycle. (d) Fits of isolated transcription cycles with the polymerase convoy model. Black dots display experimental values of TS intensities (in number of full-length pre-mRNA molecules) as a function of time (in s). Red curves show best fit to the model. vel: estimated elongation rate; tsp: spacing. Underlined number: only a minimum value was estimated for vel. (e) Box-plots representing the parameter values of the best-fit models, measured for a set of 90 isolated transcription cycles. Bottom dotted line displays the first quartile, the box corresponds to the second and third quartile, the top dotted line to the last quartile, and the horizontal line to the median. Small circles are outliers (1.5 times the inter-quartile range above or below the upper and lower quartile, respectively). (f) Estimation of mean values of tspace and vel from a regression analysis of pooled UP ramps. Graph displays duration of UP ramps as a function of Npol. Each circle is an UP ramp. Red line is the linear trend. (g) Correlation between tspace and Npol. Each isolated transcription cycle is represented by a black circle. Red curve shows a linear fit of the data. (h) Schematic indicating how stochastic ON/OFF switching of a promoter creates polymerase convoys. (i) Histograms of the duration of individual convoys and time intervals between convoys. Data are from isolated transcription cycles. Convoy duration is estimated by multiplying Npol with tspace, and time between convoys is the time between the end of the UP ramp of an isolated transcription cycle and the beginning of the next UP ramp (tmean is the average).
Figure 3
Figure 3. Effect of Mediator and TATA box on HIV-1 transcription and on short time scales.
(a) Schematic of an initiating polymerase. Mediator is in blue; GTFs in violet; upstream enhancers and bound factors in green; RNAPII in orange. (b) Intensities of TS over time. Each lane is a cell and TS intensity is colour coded, and expressed in equivalent number of full-length RNA molecules. Note that the scale is different than in f and Fig. 2b. (c) Analysis of convoy parameters in control cells or in cells lacking a functional Mediator complex. Box-plots display the convoy parameter distributions obtained by fitting individual transcription cycles as in Fig. 2d, using cells treated with siRNAs targeting Med11 (siMed11) or firefly luciferase as control (siFFL). Untreated wild-type reporter cells: WT. Asterisks: P value <0.05 (KS test, n>36). Data are from short movies. (d) Sequences of the HIV-1 TATA box and its mutants. (e) Expression of HIV-1 pre-mRNAs in the WT and mutant reporters. Values are numbers of nucleoplasmic pre-RNAs per cell, as detected by smFISH, and are shown for two independent clones. Dark blue: the clones used for live-cell analysis. (f) Intensities of TS over time. Each lane is a cell and TS intensity is colour coded, and expressed in equivalent number of full-length RNA molecules. (g) Convoy parameters in HIV-1 WT and mutant promoters. Box-plots display the distribution of the parameters obtained by fitting isolated transcription cycles with the polymerase convoy model (N>100 for 1T2G and 4G; N>90 for WT). Data are from short movies.
Figure 4
Figure 4. Effect of Mediator and TATA box on HIV-1 transcription and on long time scales.
(a) Fluctuation of TS insensities over long time scales, for WT and 4G TATA mutant. Graphs display the integrated fluorescence intensity of individual TS recorded over 8 h (in a.u.), with one image stack recorded every 3 min (long movies). Time scale is in hours (x axis). Green bars: permissive periods; red bars: non-permissive periods. One panel is one cell, with the reporter name indicated in a black box. (b) Distribution of permissive and non-permissive periods of many TS, for HIV-1 WT and TATA box mutants. Graphs show the permissive and non-permissive periods in green and red, respectively, with each line being an individual cell. The x axis is time, in h. The name of the reporter is indicated on the top. (c) Distribution of permissive and non-permissive periods for control and MED11 knocked-down cells. Legend as in b.
Figure 5
Figure 5. Modelling of the distribution of mature and nascent HIV-1 RNA in High Tat cells.
(a) Kinetic scheme of the promoter states identified in live-cell experiments. Left: schematic of a model with three promoter states accounting for permissive and non-permissive periods. Middle: schematic describing promoter state over time (top), and corresponding polymerase initiation events (bottom). Right: TS intensity measurements (middle) and the corresponding data extracted from short movies (top), or long movies (bottom). (b) Best-fit simulated distribution of the number of released and nascent pre-mRNA per cell, for the different reporters. Experimental RNA distribution are from smFISH data with the indicated reporter (green) and best-fit distributions are from the model of a (red). See Supplementary Fig. 6 for parameter values. (c) FRAP analysis of the dynamic of GFP-TBP (green) and GFP-MED11 (red) in the nucleoplasm of HeLa cells. Numbers represent the mean fluorescent intensities of the bleached spot (1.3-μm diameter) over time, after photobleaching correction and normalization to pre-bleach values (n>12;±s.d.).
Figure 6
Figure 6. Kinetic analysis of the POLR2A promoter activity and model of polymerase convoy.
(a,b) Activity of the POLR2A promoter analysed at high temporal resolution and short time scales. In a, left panels, x axis is time and y axis is the TS intensity, expressed in equivalent number of full-length RNA molecules. In a, right panel, each lane is a cell and the TS intensity is colour coded. In b, box-plots display the convoy parameter distributions obtained by fitting individual transcription cycles (legend as in Fig. 2e). Data are from short movies; time scale is in min. (c,d) Activity of the POLR2A promoter over long time scales. Graphs show the permissive and non-permissive periods displayed in green and red, respectively. (c) Graphs display the integrated fluorescence intensity of individual TS recorded over 8 h (in a.u.). (d) Each line is an individual cell. Data are from long movies; time scale is in h. (e) Physical modelling of an elongating polymerase convoy. Top: DNA screws into an elongating polymerase convoys. Bottom: a polymerase stops and generates supercoiling constraints with the preceding and succeeding polymerases. Fi indicates forces encountered by the ith polymerase.

Comment in

Similar articles

Cited by

References

    1. Grünberg S. & Hahn S. Structural insights into transcription initiation by RNA polymerase II. Trends Biochem. Sci. 38, 603–611 (2013). - PMC - PubMed
    1. Kandiah E., Trowitzsch S., Gupta K., Haffke M. & Berger I. More pieces to the puzzle: recent structural insights into class II transcription initiation. Curr. Opin. Struct. Biol. 24, 91–97 (2014). - PubMed
    1. Thomas M. & Chiang C. The general transcription machinery and general cofactors. Crit. Rev. Biochem. Mol. Biol. 41, 105–178 (2006). - PubMed
    1. Dynlacht B., Hoey T. & Tjian R. Isolation of coactivators associated with the TATA-binding protein that mediate transcriptional activation. Cell 66, 563–576 (1991). - PubMed
    1. Pugh B. Control of gene expression through regulation of the TATA-binding protein. Gene 255, 1–14 (2000). - PubMed

Publication types