. 2016 Sep 19;44(16):7830-47.
doi: 10.1093/nar/gkw651. Epub 2016 Jul 20.

DNA minicircles clarify the specific role of DNA structure on retroviral integration

Affiliations

DNA minicircles clarify the specific role of DNA structure on retroviral integration

Marco Pasi et al. Nucleic Acids Res. .

Abstract

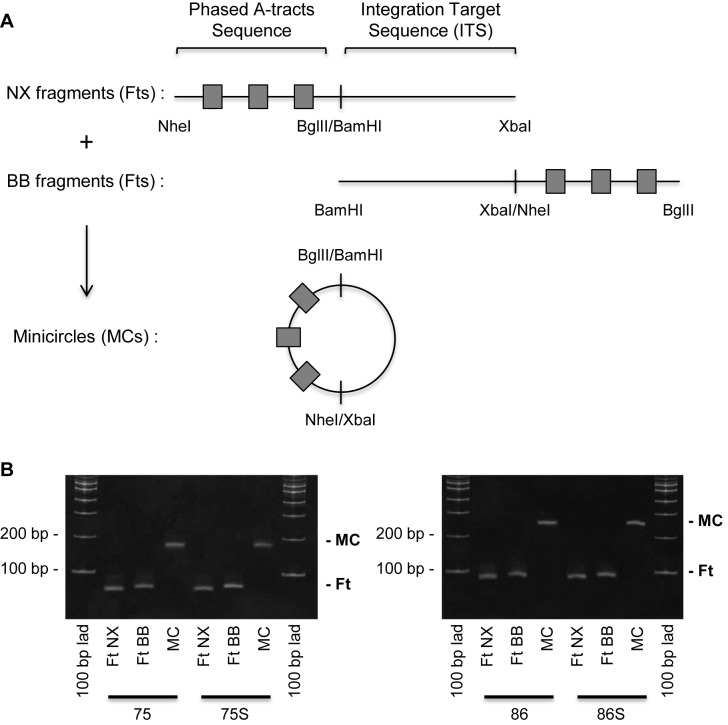
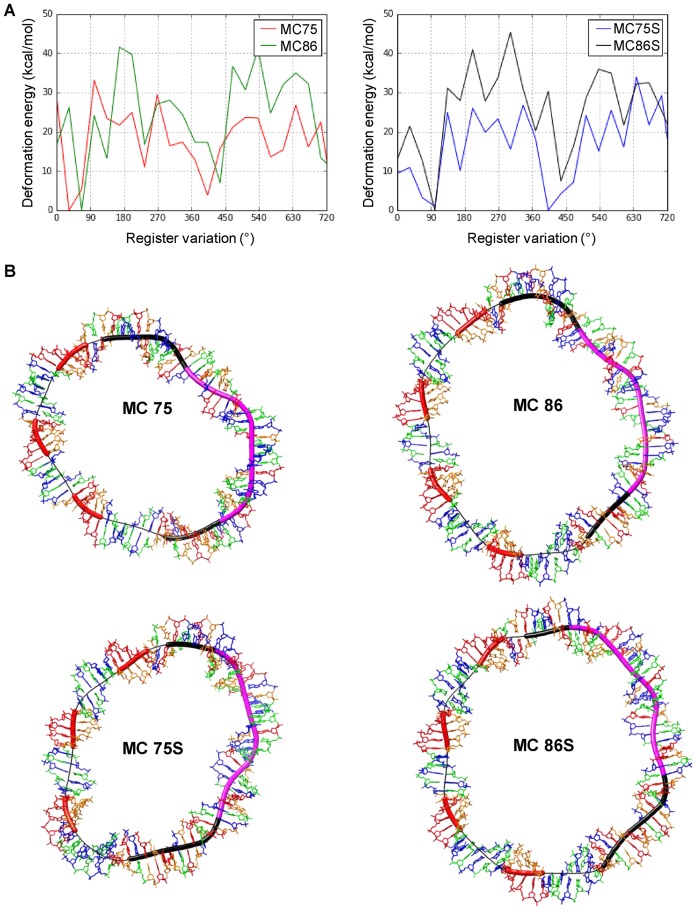
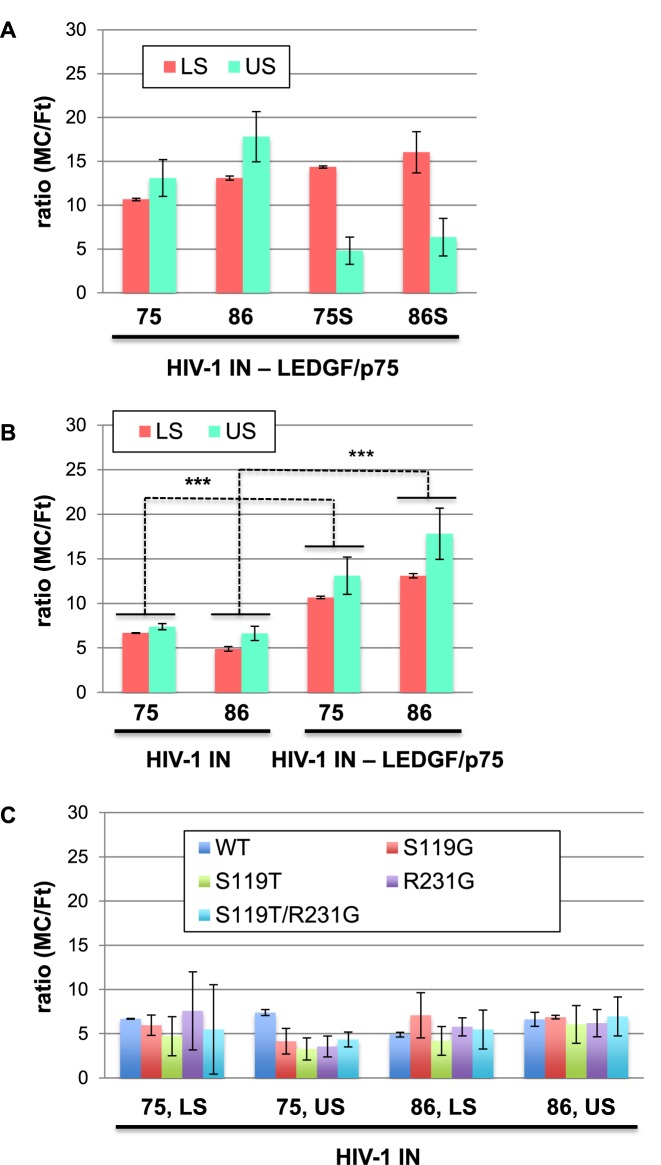
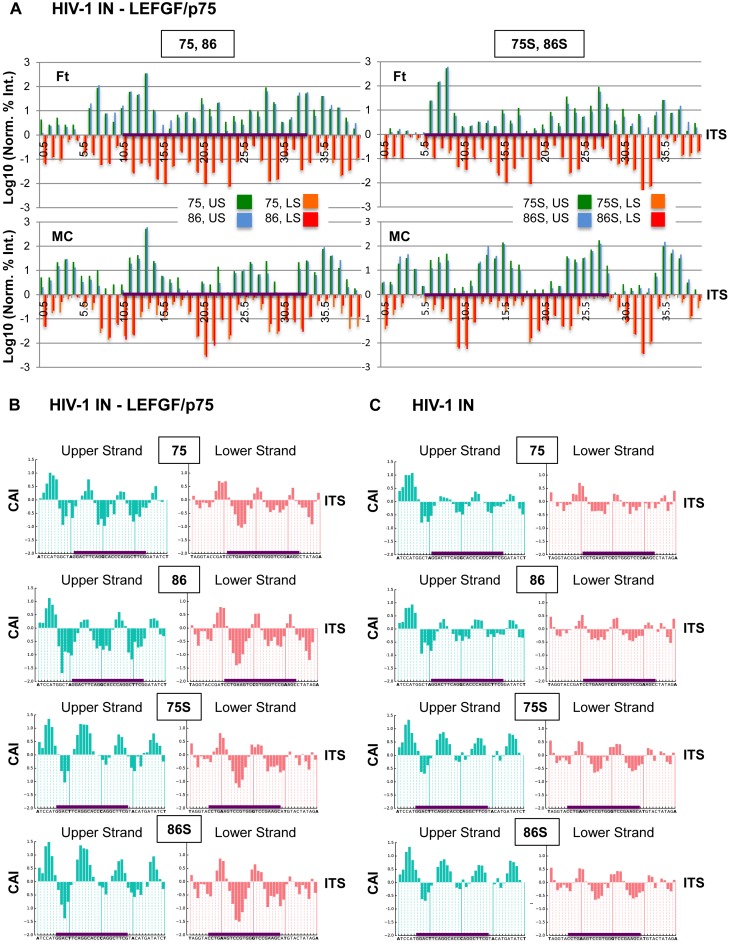
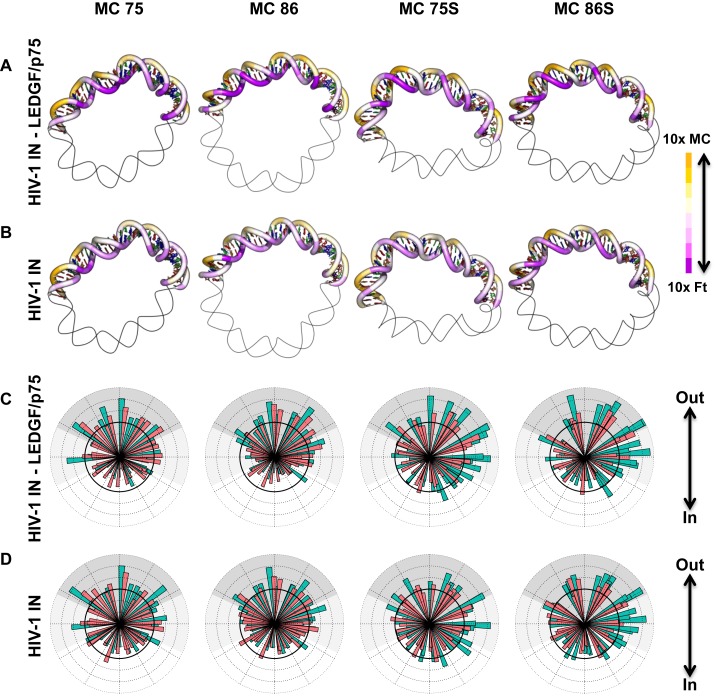
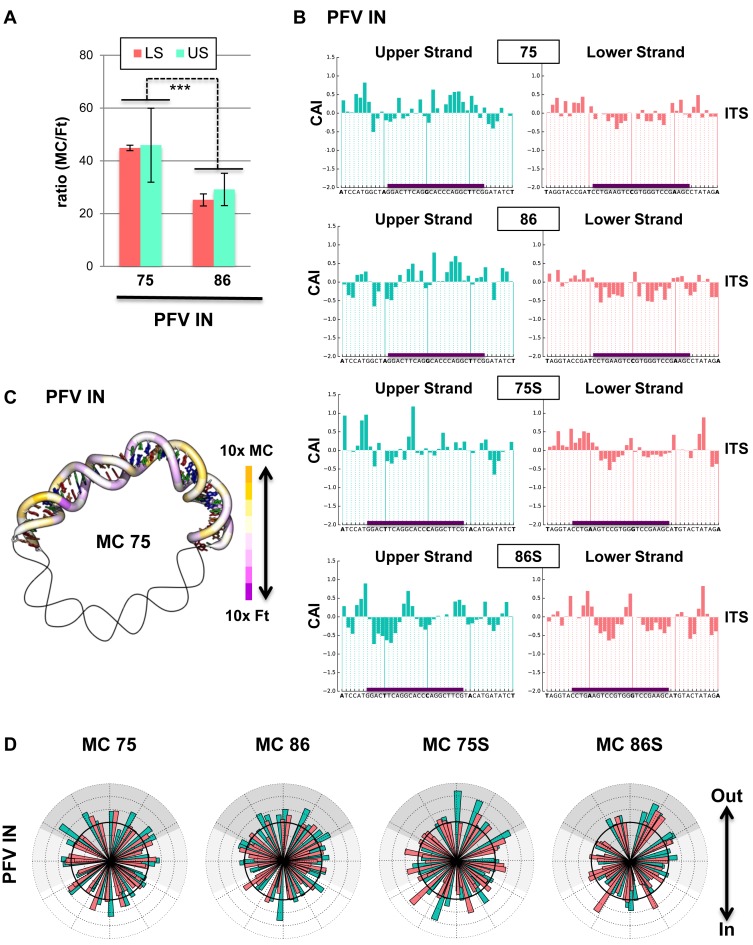
Chromatin regulates the selectivity of retroviral integration into the genome of infected cells. At the nucleosome level, both histones and DNA structure are involved in this regulation. We propose a strategy that allows to specifically study a single factor: the DNA distortion induced by the nucleosome. This strategy relies on mimicking this distortion using DNA minicircles (MCs) having a fixed rotational orientation of DNA curvature, coupled with atomic-resolution modeling. Contrasting MCs with linear DNA fragments having identical sequences enabled us to analyze the impact of DNA distortion on the efficiency and selectivity of integration. We observed a global enhancement of HIV-1 integration in MCs and an enrichment of integration sites in the outward-facing DNA major grooves. Both of these changes are favored by LEDGF/p75, revealing a new, histone-independent role of this integration cofactor. PFV integration is also enhanced in MCs, but is not associated with a periodic redistribution of integration sites, thus highlighting its distinct catalytic properties. MCs help to separate the roles of target DNA structure, histone modifications and integrase (IN) cofactors during retroviral integration and to reveal IN-specific regulation mechanisms.


Figures

Figure 1.
Figure 1.
Linear DNA fragments (Fts) and Minicircles (MCs) used for the study. (A) Selected sequences and circularization strategy. The four selected sequences, called 75, 86, 75S and 86S, were obtained as two overlapping Fts, NheI/XbaI (NX) and BamHI/BglII (BB), that were used to synthesize the corresponding MCs. (B) Control of the circularization. Ethidium-bromide staining of linear Fts and MCs separated by 8% PA-TBE electrophoretic migration.
Figure 2.
Figure 2.
Structural modeling of DNA MCs. (A) Deformation energy as a function of register variation for the MC75 and MC86 constructs and the MC75S and MC86S constructs, showing sharp troughs every ∼10 bp. (B) Representative 3D structures of the MC75, MC75S, MC86 and MC86S constructs shown as sticks, colored according to the base type (A red, C green, G blue and T orange); the Curves+ DNA helical axis is shown as a thin black line, with thicker regions to highlight specific portions of the MCs: black and purple for the ITS (purple is specific of the 23-bp segment common to the four constructs) and red for the phased A-tracts. Molecular graphics were produced using Chimera.
Figure 3.
Figure 3.
Effect of DNA circularization on the efficiency of HIV-1 integration. (A) MC/Ft ratio of integration efficiency by the HIV-1 IN–LEDGF/p75 complex, in the lower strand (LS) and upper strand (US) of the 75, 86, 75S and 86S constructs. (B) MC/Ft ratio of integration efficiency by HIV-1 IN and HIV-1 IN–LEDGF/p75 complex, in the LS and US of the 75 and 86 constructs (*** corresponds to P-values < 0.001). (C) MC/Ft ratio of integration efficiency by the WT, S119G, S119T, R231G and S119T/R231G HIV-1 INs, in the LS and US of the 75 and 86 constructs. Error bars correspond to 95% confidence intervals of the calculated ratios (A–C).
Figure 4.
Figure 4.
Effect of DNA circularization on HIV-1 IN selectivity of integration. (A) Distribution of HIV-1 IN–LEDGF/p75 integration sites along Fts and MCs. Log10 value of normalized efficiencies of integration were plotted along the ITSs of 75, 86, 75S, 86S constructs, in Ft and MC conformations. Integration in the US and LS are represented as positive and negative values respectively. The purple line along the abscissa axis represents the 23-bp segment common to the four constructs. (B and C) Effect of DNA circularization on the HIV-1 integration sites. The CAI values were calculated from integration frequencies measured with HIV-1 IN–LEDGF/p75 (B) or HIV-1 IN (C) and were plotted along the ITSs of the 75, 86, 75S and 86S constructs. Integration in the US and LS are represented on the left and right panels, respectively. The purple line along the abscissa axis represents the 23-bp segment common to the four constructs. The ITSs are represented by their position with respect to the phased attracts domain (A) or their nucleotide sequence (B and C).
Figure 5.
Figure 5.
Distribution of MC-regulated HIV-1 integration sites along the MC structures. (A and B) CAI values obtained with the HIV-1 IN–LEDGF/p75 complex (A) or HIV-1 IN (B) are plotted on the 3D structures of the MC75, MC75S, MC86 and MC86S using a color gradient code where yellow/purple reflects enhanced integration in the MCs/Fts. Only values pertaining to the ITSs are shown: bases are shown as sticks, colored according to the base type (see caption to Figure 2). (C and D) Rose-plot representation of MC enhanced integration efficiencies on the upper strand (green bars) and the lower strand (red bars). CAI values obtained with the HIV-1 IN–LEDGF/p75 complex (C) or HIV-1 IN (D), for each base-pair step along the ITSs are plotted radially as a function of the φ angle of the center of the corresponding IN binding site. Values above the thick dark circle indicate MC-enhanced integration. The top half of the dial (shaded dark gray) corresponds to the major groove facing toward the outside of the MC (Out), while the bottom half of the dial corresponds to the major groove facing inside (In). Lightly shaded areas at the boundaries of the In and Out regions represent the uncertainty in the in/out definition, measured as the average fluctuation of the φ angle measured during a MD simulation of MC75 (see main text and ‘Materials and Methods’ section for details). Molecular graphics and rose plots were produced using Chimera and Matplotlib v1.5.0., respectively.
Figure 6.
Figure 6.
Effect of DNA circularization on the efficiency and selectivity of PFV integration. (A) MC/Ft ratio of integration efficiency by PFV IN, in the LS and US of the 75 and 86 constructs (error bars correspond to 95% confidence intervals of the calculated ratios and *** corresponds to P-values < 0.001). (B and C) CAI values obtained with PFV IN were plotted along the ITSs of 75, 86, 75S and 86S constructs (B) (similarly as in Figure 4B and C) or on the 3D-modeled structures of MC75 (C) (using a similar color gradient code as in Figure 5A). (D) Rose-plot representation of MC enhanced PFV integration efficiencies (CAI values) on the upper strand (green bars) and the lower strand (red bars) of the four selected constructs. This representation is similar as in Figure 5B.
Figure 7.
Figure 7.
Low-resolution 3D model of the HIV-1 IN–LEFGF/p75 complex bound to the 75 and 86 bp MCs. The 14 Å-resolution cryo-EM density map of the HIV-1 IN–LEFGF/p75 complex (21) is shown as a semi-transparent gray isodensity surface; densities at the same resolution obtained from the modeled structures of MC75 and MC86 are shown as red and orange isodensity surfaces, respectively. Measurements on the right of the picture are approximate, and provided to guide the comparison of relative sizes. The image was produced using Chimera (61).

Similar articles

Cited by

References

    1. Engelman A., Cherepanov P. Retroviral integrase structure and DNA recombination mechanism. Microbiol. Spectr. 2014;2:1–22. - PMC - PubMed
    1. Di Santo R. Inhibiting the HIV integration process: past, present, and the future. J. Med. Chem. 2014;57:539–566. - PMC - PubMed
    1. Demeulemeester J., De Rijck J., Gijsbers R., Debyser Z. Retroviral integration: site matters: mechanisms and consequences of retroviral integration site selection. Bioessays. 2015;37:1202–1214. - PMC - PubMed
    1. Serrao E., Engelman A.N. Sites of retroviral DNA integration: from basic research to clinical applications. Crit. Rev. Biochem. Mol. Biol. 2015;51:26–42. - PMC - PubMed
    1. Lelek M., Casartelli N., Pellin D., Rizzi E., Souque P., Severgnini M., Di Serio C., Fricke T., Diaz-Griffero F., Zimmer C., et al. Chromatin organization at the nuclear pore favours HIV replication. Nat. Commun. 2015;6:6483. - PMC - PubMed

Publication types