. 2017 Feb;28(2):504-519.
doi: 10.1681/ASN.2015080910. Epub 2016 Jul 19.

Inhibition of Bromodomain and Extraterminal Domain Family Proteins Ameliorates Experimental Renal Damage

Affiliations

Inhibition of Bromodomain and Extraterminal Domain Family Proteins Ameliorates Experimental Renal Damage

Beatriz Suarez-Alvarez et al. J Am Soc Nephrol. 2017 Feb.

Abstract

Renal inflammation has a key role in the onset and progression of immune- and nonimmune-mediated renal diseases. Therefore, the search for novel anti-inflammatory pharmacologic targets is of great interest in renal pathology. JQ1, a small molecule inhibitor of bromodomain and extraterminal (BET) proteins, was previously found to preserve renal function in experimental polycystic kidney disease. We report here that JQ1-induced BET inhibition modulated the in vitro expression of genes involved in several biologic processes, including inflammation and immune responses. Gene silencing of BRD4, an important BET protein, and chromatin immunoprecipitation assays showed that JQ1 alters the direct association of BRD4 with acetylated histone-packaged promoters and reduces the transcription of proinflammatory genes (IL-6, CCL-2, and CCL-5). In vivo, JQ1 abrogated experimental renal inflammation in murine models of unilateral ureteral obstruction, antimembrane basal GN, and infusion of Angiotensin II. Notably, JQ1 downregulated the expression of several genes controlled by the NF-κB pathway, a key inflammatory signaling pathway. The RelA NF-κB subunit is activated by acetylation of lysine 310. In damaged kidneys and cytokine-stimulated renal cells, JQ1 reduced the nuclear levels of RelA NF-κB. Additionally, JQ1 dampened the activation of the Th17 immune response in experimental renal damage. Our results show that inhibition of BET proteins reduces renal inflammation by several mechanisms: chromatin remodeling in promoter regions of specific genes, blockade of NF-κB pathway activation, and modulation of the Th17 immune response. These results suggest that inhibitors of BET proteins could have important therapeutic applications in inflammatory renal diseases.

Keywords: Cell Signaling; chemokine; transcription factors.


Figures

Figure 1.
Figure 1.
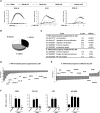
JQ1 downregulates proinflammatory gene expression in cultured renal cells. (A) Renal tubular epithelial cells (HK2 cell line) were preincubated with vehicle (DMSO), different concentrations of the BET proteins inhibitor JQ1 (100, 250, or 500 nM), or the nonactive control (−)JQ1 (500 nM) for 1 hour, and then, cells were stimulated with TNF-α (5 ng/ml) for the indicated times. Gene expression levels of CCL-2, CCL-5, and IL-6 were analyzed by real–time quantitative PCR. Results of six independent experiments are presented. In vehicle-treated cells, there were no changes in gene expression compared with untreated cells (considered as control). (B–F) BET bromodomain inhibition regulates the transcriptional program in renal tubular epithelial cells under proinflammatory conditions. HK2 cells were stimulated with TNF-α (5 ng/ml) for 3 hours in the presence of JQ1 or the nonactive control (−)JQ1 (500 nM) and analyzed by (B–E) whole–genome gene expression arrays or (F) real–time quantitative PCR. (B) Pie chart of the percentages of differentially expressed probes in each cluster: I, upregulated probes in TNF-α–stimulated cells versus untreated cells showing only those suppressed by JQ1; II, upregulated probes in TNF-α that were unchanged after JQ1 treatment; and III, downregulated probes in TNF-α–stimulated cells. (C) Functional analysis pathways (gene ontology [GO] analysis) of genes differentially expressed in clusters I and II. D and E show representative genes of I and II clusters. Genes with >1.5-fold change were considered to be differentially expressed. (F) Data validation by real–time quantitative PCR. Data are expressed as means±SEM of three independent experiments. *P<0.05 versus control (vehicle-treated cells); #P<0.05 versus TNF-α–treated cells.
Figure 2.
Figure 2.
BRD4 disruption inhibits TNF-α–induced upregulation of proinflammatory genes in renal tubular epithelial cells. HK2 cells were transfected with a pool of BRD4 siRNA or nonspecific scramble siRNA (40 nM) for 48 hours. Cells were then treated with TNF-α (5 ng/ml) for 3 hours more. Gene expression of BRD4 and the proinflammatory genes CCL-2, CCL-5 and IL-6 was measured by real–time quantitative PCR. Data are representative of four independent experiments, and results are expressed as the means±SEM. *P<0.05 versus control untransfected cells; #P<0.05 versus nonspecific scramble siRNA.
Figure 3.
Figure 3.
JQ1 inhibits the direct binding of BRD4 at the CCL-2, CCL-5, and IL-6 promoters through histone acetylation in renal tubular epithelial cells. HK2 cells were pretreated with (−)JQ1 or JQ1 (500 nM) for 1 hour and further stimulated with TNF-α (5 ng/ml) for 3 hours more. ChIP assays were performed using specific antibodies against (A) BRD4, (B) AcH3, and (C) AcH4. Normal rabbit IgG was used as a negative control. Enrichment of BRD4–specific DNA sequences around the transcriptional sites of the human CCL-2, CCL-5, and IL-6 promoters was measured by real–time quantitative PCR using specific primers. Data from three independent experiments are shown, in which each quantitative PCR was run in triplicate. Results are represented as the relative enrichment of BRD4 binding compared with the negative control antibody (IgG). *P<0.05 versus corresponding IgG; #P<0.05 versus (−)JQ1-treated cells.
Figure 4.
Figure 4.
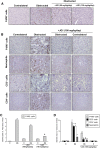
JQ1 reduces renal inflammation in the experimental models of UUO. The UUO model was done in mice and studied after (A) 2 or (B) 5 days. Some mice were treated with JQ1 (60 or 100 mg/kg per day intraperitoneally as indicated) or vehicle (10% hydroxypropyl β-cyclodextrin) starting 24 hours before UUO. In paraffin–embedded kidney sections, inflammatory cell infiltration was evaluated using antibodies against F4/80 (monocytes/macrophages/dendritic cells), myeloperoxidase (neutrophils), CD3 (T lymphocytes), and CD4 (T helper lymphocytes). A representative animal from each group is shown. Magnification, ×200×. C and D show the quantification of immunohistochemistry. Data are expressed as the means±SEM of six to eight animals per group. *P<0.05 versus contralateral (C); #P<0.05 versus vehicle–treated obstructed (Ob) kidneys.
Figure 5.
Figure 5.
JQ1 attenuates gene expression of proinflammatory factors in obstructed kidneys. Mice were treated with JQ1 (100 or 60 mg/kg per day) or vehicle (10% cyclodextran solution) starting 24 hours before UUO and studied after 2 or 5 days. (A and B) RNA was isolated from frozen samples of whole kidney, and gene expression levels were evaluated by real–time quantitative PCR. (C) CCL-2 protein levels were evaluated by ELISA. Results are means±SEM of six to eight animals per group. Data are normalized versus contralateral untreated kidney (considered as one). (D) BRD4 downregulates the proinflammatory gene expression in the damaged kidney. (E) A ChIP assay was carried out in renal samples from UUO mice treated or not treated with JQ1 using an antibody specific for BRD4 or normal rabbit IgG, the latter being a negative control. Enrichment of BRD4 binding regions in the promoters of mouse Ccl-2, Ccl-5, and Il-6 genes was quantified by quantitative PCR using specific primers. Data are from two independent experiments, and each quantitative PCR was run in triplicate. Results are expressed as the n-fold enrichment of anti-BRD4 antibody relative to a negative control antibody (normal rabbit IgG) and further normalized versus contralateral kidney (considered as one). *P<0.05 versus contralateral (C); #P<0.05 versus vehicle–treated obstructed (Ob) kidneys.
Figure 6.
Figure 6.
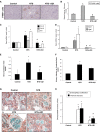
JQ1 diminishes renal inflammation in the NTS nephritis. Accelerated NTS nephritis was done in mice by administration of an antimurine glomerular basement membrane rabbit antiserum, and mice were studied 10 days after immunization. Mice were treated or not treated with JQ1 (100 mg/kg per day) starting before the first NTS injection. (A) In paraffin–embedded kidney sections of NTS mice, glomerular infiltration of monocytes/macrophages was found (detected using an antibody against F4/80). B shows the quantification of immunohistochemistry. (C and D) RNA was isolated from frozen samples of whole kidney, and gene expression levels were evaluated by real–time quantitative PCR. (E) JQ1 ameliorates renal damage in the NTS nephritis. Data on (E) serum creatinine levels and (F) the ratio of albumin to creatinine in the urine are shown. Data are expressed as the means±SEM of five to seven animals per group. Morphologic lesions were evaluated by Masson trichrome staining. Treated mice with JQ1 (100 mg/kg per day) displayed fewer and less severe glomerular lesions. G shows a representative animal from each group, and the quantification of the lesion is shown in H. Magnification, ×200 in G; ×400 in G, b. *P<0.05 versus control; #P<0.05 versus NTS.
Figure 7.
Figure 7.
JQ1 diminishes renal inflammation in the model of AngII infusion in mice. Systemic infusion of AngII (1000 ng/kg per minute; subcutaneous osmotic mini-pumps) was done for 3 days. Mice were treated or not treated with JQ1 (100 mg/kg per day) starting 24 hours before infusion. (A) In paraffin–embedded kidney sections of AngII-infused mice, some interstitial infiltrating monocytes/macrophages were found (detected using an antibody against F4/80; marked by arrows). A representative animal from each group is shown. (B) Shows the quantification of immunohistochemistry. (C) RNA was isolated from frozen samples of whole kidney, and proinflammatory gene expression levels were evaluated by real–time quantitative PCR. (D) Data of serum creatinine levels. (E) Renal Ngal gene expression and (F) protein levels are shown. Data are expressed as the means±SEM of four to six animals per group. *P<0.05 versus control; #P<0.05 versus AngII-infused mice.
Figure 8.
Figure 8.
JQ1 inhibits NF-κB pathway activation in renal cells and murine damaged kidney. HK2 cells were pretreated with 500 nM JQ1 for 1 hour and stimulated with 5 ng/ml TNF-α for 20 minutes. (A) Activation of NF-κB was evaluated in terms of changes in phosphorylation levels of IκBα (p-IκBα) and the p65 NF-κB subunit (p-RelA) in total protein extracts by Western blot. GAPDH was used as the loading control. (B) Quantification. Means±SEM of three independent experiments. *P<0.05 versus control; #P<0.05 versus TNF-α. (C) Activation of NF-κB was evaluated by p65 NF-κB subunit (RelA) in nuclear extracts by Western blot. Histone H1 was used as the loading control. Means±SEM of three independent experiments. *P<0.05 versus control; #P<0.05 versus TNF-α. (D–F) In nuclear proteins isolated from different mice models treated or not treated with JQ1, p65 NF-κB levels were evaluated by Western blot. Ponceau Red was used as the loading control. *P<0.05 versus control mice; #P<0.05 versus injured kidneys (obstructed;NTS;AngII respectively). Data are expressed as the means±SEM of six to eight animals per group.
Figure 9.
Figure 9.
JQ1 diminishes the Th17 immune response in experimental renal damage. Renal IL-17A (A) gene or (B) protein levels were evaluated in the UUO model by real time or Western blot, respectively; GAPDH or Tubulin was used as the loading control, respectively. Data are expressed as the means±SEM of six to eight animals per group. C, control; Ob, obstructed. *P<0.05 versus control mice; #P<0.05 versus injured kidney. Immunolocalization of IL-17A in (C) UUO or (D) NTS mice treated or not treated with JQ1. The figure shows a representative image of five mice per group.

Similar articles

Cited by

References

    1. Dwivedi RS, Herman JG, McCaffrey TA, Raj DS: Beyond genetics: Epigenetic code in chronic kidney disease. Kidney Int 79: 23–32, 2011 - PMC - PubMed
    1. Smyth LJ, McKay GJ, Maxwell AP, McKnight AJ: DNA hypermethylation and DNA hypomethylation is present at different loci in chronic kidney disease. Epigenetics 9: 366–376, 2014 - PMC - PubMed
    1. Reddy MA, Natarajan R: Recent developments in epigenetics of acute and chronic kidney diseases. Kidney Int 88: 250–261, 2015 - PMC - PubMed
    1. Dressler GR, Patel SR: Epigenetics in kidney development and renal disease. Transl Res 165: 166–176, 2015 - PMC - PubMed
    1. Filippakopoulos P, Picaud S, Mangos M, Keates T, Lambert JP, Barsyte-Lovejoy D, Felletar I, Volkmer R, Müller S, Pawson T, Gingras AC, Arrowsmith CH, Knapp S: Histone recognition and large-scale structural analysis of the human bromodomain family. Cell 149: 214–231, 2012 - PMC - PubMed

MeSH terms