In silico phylogenomics using complete genomes: a case study on the evolution of hominoids
- PMID: 27435933
- PMCID: PMC5052044
- DOI: 10.1101/gr.203950.115
In silico phylogenomics using complete genomes: a case study on the evolution of hominoids
Abstract
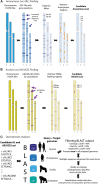
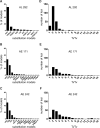
The increasing availability of complete genome data is facilitating the acquisition of phylogenomic data sets, but the process of obtaining orthologous sequences from other genomes and assembling multiple sequence alignments remains piecemeal and arduous. We designed software that performs these tasks and outputs anonymous loci (AL) or anchored enrichment/ultraconserved element loci (AE/UCE) data sets in ready-to-analyze formats. We demonstrate our program by applying it to the hominoids. Starting with human, chimpanzee, gorilla, and orangutan genomes, our software generated an exhaustive data set of 292 ALs (∼1 kb each) in ∼3 h. Not only did analyses of our AL data set validate the program by yielding a portrait of hominoid evolution in agreement with previous studies, but the accuracy and precision of our estimated ancestral effective population sizes and speciation times represent improvements. We also used our program with a published set of 512 vertebrate-wide AE "probe" sequences to generate data sets consisting of 171 and 242 independent loci (∼1 kb each) in 11 and 13 min, respectively. The former data set consisted of flanking sequences 500 bp from adjacent AEs, while the latter contained sequences bordering AEs. Although our AE data sets produced the expected hominoid species tree, coalescent-based estimates of ancestral population sizes and speciation times based on these data were considerably lower than estimates from our AL data set and previous studies. Accordingly, we suggest that loci subjected to direct or indirect selection may not be appropriate for coalescent-based methods. Complete in silico approaches, combined with the burgeoning genome databases, will accelerate the pace of phylogenomics.
© 2016 Costa et al.; Published by Cold Spring Harbor Laboratory Press.
Figures


Similar articles
-
Genomic relationships and speciation times of human, chimpanzee, and gorilla inferred from a coalescent hidden Markov model.PLoS Genet. 2007 Feb 23;3(2):e7. doi: 10.1371/journal.pgen.0030007. Epub 2006 Nov 30. PLoS Genet. 2007. PMID: 17319744 Free PMC article.
-
Estimation of hominoid ancestral population sizes under bayesian coalescent models incorporating mutation rate variation and sequencing errors.Mol Biol Evol. 2008 Sep;25(9):1979-94. doi: 10.1093/molbev/msn148. Epub 2008 Jul 4. Mol Biol Evol. 2008. PMID: 18603620
-
Reconstructing the demographic history of the human lineage using whole-genome sequences from human and three great apes.Genome Biol Evol. 2012;4(11):1133-45. doi: 10.1093/gbe/evs075. Genome Biol Evol. 2012. PMID: 22975719 Free PMC article.
-
[Molecular phylogeny of humans, chimpanzees and gorillas].Tanpakushitsu Kakusan Koso. 2000 Dec;45(16):2588-95. Tanpakushitsu Kakusan Koso. 2000. PMID: 11185912 Review. Japanese. No abstract available.
-
Evolution and demography of the great apes.Curr Opin Genet Dev. 2016 Dec;41:124-129. doi: 10.1016/j.gde.2016.09.005. Epub 2016 Oct 4. Curr Opin Genet Dev. 2016. PMID: 27716526 Review.
Cited by
-
Genome Evolution and the Future of Phylogenomics of Non-Avian Reptiles.Animals (Basel). 2023 Jan 29;13(3):471. doi: 10.3390/ani13030471. Animals (Basel). 2023. PMID: 36766360 Free PMC article. Review.
-
PhyloWGA: chromosome-aware phylogenetic interrogation of whole genome alignments.Bioinformatics. 2021 Jul 27;37(13):1923-1925. doi: 10.1093/bioinformatics/btaa884. Bioinformatics. 2021. PMID: 33051672 Free PMC article.
-
ExRec: a python pipeline for generating recombination-filtered multi-locus datasets.Bioinform Adv. 2023 Nov 29;3(1):vbad174. doi: 10.1093/bioadv/vbad174. eCollection 2023. Bioinform Adv. 2023. PMID: 38089112 Free PMC article.
-
Homology-Aware Phylogenomics at Gigabase Scales.Syst Biol. 2017 Jul 1;66(4):590-603. doi: 10.1093/sysbio/syw104. Syst Biol. 2017. PMID: 28123115 Free PMC article.
-
Conserved Nonexonic Elements: A Novel Class of Marker for Phylogenomics.Syst Biol. 2017 Nov 1;66(6):1028-1044. doi: 10.1093/sysbio/syx058. Syst Biol. 2017. PMID: 28637293 Free PMC article.
References
-
- Bertozzi T, Sanders KL, Sistrom MJ, Gardner MG. 2012. Anonymous nuclear loci in non-model organisms: making the most of high throughput genome surveys. Bioinformatics 28: 1807–1810. - PubMed
-
- Brito PH, Edwards SV. 2009. Multilocus phylogeography and phylogenetics using sequence based markers. Genetica 135: 439–455. - PubMed
-
- Burgess R, Yang Z. 2008. Estimation of hominoid ancestral population sizes under Bayesian coalescent models incorporating mutation rate variation and sequencing errors. Mol Biol Evol 25: 1979–1994. - PubMed
Publication types
MeSH terms
Associated data
LinkOut - more resources
Full Text Sources
Other Literature Sources
Miscellaneous
