. 2016 Aug;24(8):1444-55.
doi: 10.1038/mt.2016.121. Epub 2016 Jun 10.

Intratumoral Infection with Murine Cytomegalovirus Synergizes with PD-L1 Blockade to Clear Melanoma Lesions and Induce Long-term Immunity

Affiliations

Intratumoral Infection with Murine Cytomegalovirus Synergizes with PD-L1 Blockade to Clear Melanoma Lesions and Induce Long-term Immunity

Dan A Erkes et al. Mol Ther. 2016 Aug.

Abstract

Cytomegalovirus is an attractive cancer vaccine platform because it induces strong, functional CD8(+) T-cell responses that accumulate over time and migrate into most tissues. To explore this, we used murine cytomegalovirus expressing a modified gp100 melanoma antigen. Therapeutic vaccination by the intraperitoneal and intradermal routes induced tumor infiltrating gp100-specific CD8(+) T-cells, but provided minimal benefit for subcutaneous lesions. In contrast, intratumoral infection of established tumor nodules greatly inhibited tumor growth and improved overall survival in a CD8(+) T-cell-dependent manner, even in mice previously infected with murine cytomegalovirus. Although murine cytomegalovirus could infect and kill B16F0s in vitro, infection was restricted to tumor-associated macrophages in vivo. Surprisingly, the presence of a tumor antigen in the virus only slightly increased the efficacy of intratumoral infection and tumor-specific CD8(+) T-cells in the tumor remained dysfunctional. Importantly, combining intratumoral murine cytomegalovirus infection with anti-PD-L1 therapy was synergistic, resulting in tumor clearance from over half of the mice and subsequent protection against tumor challenge. Thus, while a murine cytomegalovirus-based vaccine was poorly effective against established subcutaneous tumors, direct infection of tumor nodules unexpectedly delayed tumor growth and synergized with immune checkpoint blockade to promote tumor clearance and long-term protection.


Figures

Figure 1
Figure 1
Construction and characterization MCMV-GFP-gp100S27P. (a) Schematic of recombinant strain MCMV-GFP-gp100S27P (MCMV-gp100) in which the altered gp100 peptide was fused to EGFP and cloned into the IE2 region of the MCMV genome. (b) The growth of MCMV-gp100 versus WT-MCMV in M2-10B4s. Data represent pooled results from two independent experiments and show the mean ± SD. (c) Representative FACS plots of CD8+ T-cell cytokine production after stimulation with the indicated peptides ex vivo. T-cells were obtained from the peripheral blood on day 104, postinfection with either MCMV-gp100 or WT-MCMV. (d) CD8+ T-cell responses to the indicated peptides over time, assessed as in c. Data is represented as the mean value ± SD from a total of five animals per group. CMV, cytomegalovirus; MCMV, vaccination with murine-CMV; EGFP, enhanced green fluorescent protein.
Figure 2
Figure 2
Intraperitoneal (IP) and intradermal (ID) infection with MCMV-gp100 induced poor antitumor responses. Animals received 1 × 105 B16F0s subcutaneously on day 0 followed by IP or IP/ID vaccination with MCMV-gp100 or WT-MCMV on day 5, post implantation. The data shown is combined from three separate experiments. (a) Lymphocytes in the tumor (top panel) and spleen (bottom panel) after MCMV-gp100 vaccination. Data are represented as the mean ± SD. Significance was assessed by unpaired t-tests, ns, P > 0.05; *P < 0.05; **P < 0.01;, ***P < 0.001; ****P < 0.0001; NKs, NK cells; Neutro, Neutrophil; Granu, Granulocyte; Macro, Macrophage; Mono, Monocyte; Treg, regulatory T cell. (b) IFN-γ production of CD8+ T-cells recovered from tumors at sacrifice and stimulated or not ex vivo with the native gp100 peptide (n = 5–9 mice). Represented as the mean ± SD. (c) Tumor growth curves showing the growth, by area, of individual tumors from unvaccinated (n = 13) MCMV-gp100 IP vaccinated (n = 9), WT-MCMV IP/ID vaccinated (n = 9), and MCMV-gp100 IP/ID vaccinated mice (n = 10). The dotted line indicates the day of vaccination. (d) Kaplan–Meier survival curve of treated animals. Significance was assessed by the logrank test, *P < 0.05; **P < 0.01; ***P < 0.001; ****P < 0.0001. CMV, cytomegalovirus; MCMV, vaccination with murine-CMV.
Figure 3
Figure 3
Intratumoral (IT) infection with MCMV induced tumor growth delay, regression, and improved survival. (a) The treatment schedule of MCMV IT infection. All tumors were initially injected at a tumor area of ~ 20 mm2. Each IT infection consisted of 5 × 105 plaque forming units. (bd) The data shown is combined from four separate experiments. (b) Tumor growth, represented as change in tumor area (mm2) over time, is shown from the day of the first IT injection. MCMV-gp100 IP/ID vaccination was given on day 5, post tumor implantation followed by PBS IT on the schedule shown in a. PBS IT (n = 6); MCMV-gp100 IP/ID → PBS IT (n = 6); WT-MCMV IT (n = 18); MCMV-gp100 IT (n = 18). Vertical dotted lines represent days of IT injection. (c) Kaplan–Meier survival curve of the different treatment groups from day of tumor implantation until tumors were above 100 mm2. Significance was assessed by a logrank test, *P < 0.05; **P < 0.01; ***P < 0.001; ****P < 0.0001. (d) Tumor lymphocyte infiltration at time of sacrifice. Data represented as the mean ± SD. Significance was assessed by an unpaired t-test, ns, P > 0.05; *P < 0.05; **P < 0.01; ***P < 0.001, P < 0.0001. NKs, NK cells; Neutro, Neutrophil; Granu, Granulocyte; Macro, Macrophage; Mono, Monocyte; Treg, regulatory T cell. (e,f) Mice latently infected with MCMV-K181 for 8 or 52 weeks received B16F0s and were infected following the schedule described in a with MCMV-gp100 (n = 8 mice infected 8 weeks previously and n = 4 mice infected 52 weeks previously) or PBS (n = 8 mice). (e) Tumor growth from the day of IT infection. (f) Kaplan–Meier survival curve of different treatment groups. Significance was assessed by a logrank test, *P < 0.05, **P < 0.01, ***P < 0.001, ****P < 0.0001. CMV, cytomegalovirus; MCMV, vaccination with murine-CMV; PBS, phosphate-buffered saline.
Figure 4
Figure 4
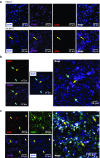
MCMV infects TAMs after IT therapy. Mice received IT injections with WT-MCMV or MCMV-gp100 as in Figure 3. Tumors were harvested 1 day after the last IT injection and processed for histology. Yellow arrows indicate pp89 positive cells. Cyan arrows indicate pp89 negative cells. (a,b) Immunofluorescence staining of pp89 (red) in tumors IT injected with PBS or MCMV. Tumors were also stained for hematopoietic cells (CD45.2, purple) and costained with DAPI (blue). (c) pp89 (red) expression colocalizes with macrophages expressing CD11b (purple) and F4/80 (green) cells, after MCMV IT infection. CMV, cytomegalovirus; MCMV, vaccination with murine-CMV; PBS, phosphate-buffered saline; DAPI, ; TAMs, tumor associated macrophages; IT, intratumoral.
Figure 5
Figure 5
Survival benefit after MCMV IT therapy depends on CD8+ T-cells. Mice were depleted of CD8+ and/or NK1.1+ cells as described in the materials and methods (n = 8 mice per group) or the relevant isotype control antibodies (n = 6 mice per group). (a) Tumor growth, represented as change in tumor area (mm2) over time, is shown from the day of the first intratumoral (IT) injection. (b) Kaplan Meier survival curves of the different antibody depletion groups compared to the relevant isotype controls from day of tumor implantation until tumors were above 100 mm2. Significance was assessed by a logrank test, *P < 0.05. CMV, cytomegalovirus; MCMV, vaccination with murine-CMV.
Figure 6
Figure 6
IT MCMV treatment combined with anti-PD-L1 therapy profoundly improves B16F0 tumor growth delay and survival. For a and b, Mice received 1 × 104 Pmel-Is one day prior to tumor implantation and were IT infected with MCMV as in Figure 3. (a) Representative histograms of the PD-1 expression of CD8+ T-cells or Pmel-Is 7 days post infection. (b) Ex vivo cytokine production and degranulation in response to native gp100 stimulation of Pmel-Is 7 days post infection and represented as the mean ± SD. Significance was assessed by a paired t-test, *P < 0.05; **P < 0.01; ***P < 0.001; ****P < 0.0001. (c) Mice bearing B16F0 tumors were treated with anti-PD-L1 or an isotype control antibody beginning on the day of MCMV IT infection. Shown is the tumor growth as in Figure 3 for the indicated groups of mice. Vertical dotted lines represent days of MCMV IT infection. Fractions in each graph represent the number of animals that cleared the tumor out of the number of animals tested. (d) Kaplan–Meier survival curve of the mice in each treatment group. Significance was assessed by a logrank test, P > 0.05 is nonsignificant; *P < 0.05; **P < 0.01; ***P < 0.001; ****P < 0.0001. CMV, cytomegalovirus; MCMV, vaccination with murine-CMV; PBS, phosphate-buffered saline; IT, intratumoral.
Figure 7
Figure 7
Primary tumor clearance after MCMV IT treatment induces resistance or rejection of secondary tumor challenges. Any animal that cleared a primary tumor was rechallenged with 2 × 105 B16F0s in their opposite flank 2–3 weeks after initial tumor clearance. (a) Shown is the tumor growth starting from the day of tumor rechallenge. For the sake of clarity and fitting the data to a log scale, individual tumor area lines are spaced out below 1 mm2 when no nodule was evident. Fractions in each graph represent the number of animals that rejected tumor challenge out of the number of animals tested. (b) Mice were infected by the IP route with 2 × 105 plaque forming units WT-MCMV or MCMV-gp100 and 2 × 105 B16F0s were implanted subcutaneously 106 days later. Shown is the tumor growth as displayed in Figure 2. T-cell responses in the blood of these mice, prior to tumor implantation, are shown in Figure 1c,d. (c) Kaplan-Meier survival curve of rechallenged mice from WT-MCMV IT + anti-PD-L1 treated, MCMV-gp100 IT + anti-PD-L1 treated and prophylactically WT-MCMV or MCMV-gp100 vaccinated mice. Significance was assessed by a logrank test, P > 0.05 is nonsignificant; *P < 0.05; **P < 0.01; ***P < 0.001; ****P < 0.0001.

Similar articles

Cited by

References

    1. Klebanoff, CA, Acquavella, N, Yu, Z and Restifo, NP (2011). Therapeutic cancer vaccines: are we there yet? Immunol Rev 239: 27–44. - PMC - PubMed
    1. Schreiber, RD, Old, LJ and Smyth, MJ (2011). Cancer immunoediting: integrating immunity's roles in cancer suppression and promotion. Science 331: 1565–1570. - PubMed
    1. Wherry, E. J. (2011). T cell exhaustion. Nature Immunol 131: 492–499. - PubMed
    1. Hailemichael, Y and Overwijk, WW (2014). Cancer vaccines: Trafficking of tumor-specific T-cells to tumor after therapeutic vaccination. Int J Biochem Cell Biol 53: 46–50. - PMC - PubMed
    1. Azimi, F, Scolyer, RA, Rumcheva, P, Moncrieff, M, Murali, R, McCarthy, SW et al. (2012). Tumor-infiltrating lymphocyte grade is an independent predictor of sentinel lymph node status and survival in patients with cutaneous melanoma. J Clin Oncol 30: 2678–2683. - PubMed

Publication types

MeSH terms