. 2016 Jul 19;12(7):e1005742.
doi: 10.1371/journal.ppat.1005742. eCollection 2016 Jul.

Features of Recently Transmitted HIV-1 Clade C Viruses that Impact Antibody Recognition: Implications for Active and Passive Immunization

Affiliations

Features of Recently Transmitted HIV-1 Clade C Viruses that Impact Antibody Recognition: Implications for Active and Passive Immunization

Cecilia Rademeyer et al. PLoS Pathog. .

Erratum in

Abstract

The development of biomedical interventions to reduce acquisition of HIV-1 infection remains a global priority, however their potential effectiveness is challenged by very high HIV-1 envelope diversity. Two large prophylactic trials in high incidence, clade C epidemic regions in southern Africa are imminent; passive administration of the monoclonal antibody VRC01, and active immunization with a clade C modified RV144-like vaccines. We have created a large representative panel of C clade viruses to enable assessment of antibody responses to vaccines and natural infection in Southern Africa, and we investigated the genotypic and neutralization properties of recently transmitted clade C viruses to determine how viral diversity impacted antibody recognition. We further explore the implications of these findings for the potential effectiveness of these trials. A panel of 200 HIV-1 Envelope pseudoviruses was constructed from clade C viruses collected within the first 100 days following infection. Viruses collected pre-seroconversion were significantly more resistant to serum neutralization compared to post-seroconversion viruses (p = 0.001). Over 13 years of the study as the epidemic matured, HIV-1 diversified (p = 0.0009) and became more neutralization resistant to monoclonal antibodies VRC01, PG9 and 4E10. When tested at therapeutic levels (10ug/ml), VRC01 only neutralized 80% of viruses in the panel, although it did exhibit potent neutralization activity against sensitive viruses (IC50 titres of 0.42 μg/ml). The Gp120 amino acid similarity between the clade C panel and candidate C-clade vaccine protein boosts (Ce1086 and TV1) was 77%, which is 8% more distant than between CRF01_AE viruses and the RV144 CRF01_AE immunogen. Furthermore, two vaccine signature sites, K169 in V2 and I307 in V3, associated with reduced infection risk in RV144, occurred less frequently in clade C panel viruses than in CRF01_AE viruses from Thailand. Increased resistance of pre-seroconversion viruses and evidence of antigenic drift highlights the value of using panels of very recently transmitted viruses and suggests that interventions may need to be modified over time to track the changing epidemic. Furthermore, high divergence such as that observed in the older clade C epidemic in southern Africa may impact vaccine efficacy, although the correlates of infection risk are yet to be defined in the clade C setting. Findings from this study of acute/early clade C viruses will aid vaccine development, and enable identification of new broad and potent antibodies to combat the HIV-1 C-clade epidemic in southern Africa.


Conflict of interest statement

The authors have declared that no competing interests exist

Figures
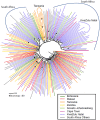
Fig 1
Fig 1. Maximum likelihood phylogenetic analysis of southern African clade C acute/early envelope nucleotide sequences (n = 200) (Table 1).
Branches are colored according to country/region. Bootstrap values > 80% of 100 resampled replicates are illustrated as filled circles on nodes. South African samples from Soweto/Johannesburg (Gauteng province), Cape Town (Western Cape Province), and KwaZulu-Natal are highlighted in light green, red, and blue respectively, sequences from other locations in South Africa are shown in grey. Clades that were from the same geographic region are highlighted. Only one of these regional grouping (>2 sequence clusters) had strong bootstrap support (4 sequences from Tanzania, highlighted in orange).
Fig 2
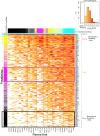
Fig 2. K-means (n = 4) neutralization clustering of clade C Env pseudoviruses for tier classification (n = 200).
Neutralization sensitivity was assessed by assaying pseudoviruses against 30 sera from chronically infected individuals. Individual viruses are indicated to the right of the heatmap with individual serum listed at the bottom. Viruses are ranked according to respective sensitivities and categorized into tiers as determined by k-means clustering. Neutralization sensitivity (log10 ID50 titer) is denoted by color key provided in the inset. Viral isolates clustering, together with >95% probability, was performed to assess the stability of the Env pseudovirus clusters based on a random-with replacement resampling of the sera (rows), or to assess the stability of the serological clusters based on resampling of the viruses (columns), and were boxed on the heatmap indicating categorization into their respective tiers. Bootstrap support for clusters was determined by resampling the data sets from the individual serum and re-evaluating the k-means clusters 10,000 times giving an indication of how many times each virus was a member of the originally assigned tier classification in the resampled datasets. Env pseudoviruses that clustered with the assigned tier are shown in the column on the left as blue for tier 1A (very sensitive), yellow for tier 1B, magenta for tier 2 (intermediate), and black for tier 3 (very resistant). This follows the tier classification of Seaman et al (2010) [16]. Similarly sera potential is illustrated at the top with the most uniformly potent sera indicated as blue, potent sera as yellow, modestly potent as magenta, and least potent as black. Color intensity indicates the probability of falling within a cluster and the degree of blending the frequency of falling into each of the respective tiers, with strong unblended colors, associated with 95% bootstrap support, boxed. The poor resolution of the k- means bootstrapping emphasizes that the sensitivity of Envs is a continuum, and will be dependent on the specific sera or antibodies used for the evaluation.
Fig 3
Fig 3. Geometric mean titer and tier 1A and 1B classification (n = 200).
(A) Viruses are rank ordered according to neutralization sensitivity to 30 clade C chronic infection serum samples, from the least sensitive to the most sensitive along the x-axis by average log10 GMTs. Two viruses were classified as highly sensitive tier 1A and an additional 17 as above-average sensitive tier 1B. A previously determined cut off ID50 = 200, was used to distinguish between tier 1A and tier 1B is indicated on the graph, with tier 1B classified viruses above this cut off colored in red and those below in orange [16]. Twelve pseudoviruses classified by both Seaman et al., (2010) and this study were found to be discrepant (S1 Table): Du156.12 consistently falls near the boundary of the tier 2 and tier 1B, was classified as tier 1B here however was previously classified as tier 2; and ZM197M and SM109F were classified as tier 2 here, however were previously classified as 1B. (B) Maximum likelihood phylogenetic analysis of southern African clade C acute/early envelope nucleotide sequences (n = 200) with branches colored according to tier. Bootstrap values > 80% of 100 resampled replicates are illustrated as filled circles on nodes.
Fig 4
Fig 4. Comparison of neutralization susceptibility and viral characteristics of pre- and post-seroconversion clade C panel viruses.
Pseudotyped clade C viruses were partitioned into three infection stage groups according to their sequential gain of HIV-1 specific antibody responses as a marker of time from infection; pre-seroconversion (Ab-) (n = 58) indicated in blue, indeterminate (Ab-/+) (n = 26) indicated in grey and post-seroconversion (Ab+) (n = 55) indicated in red. Each point represents the geometric mean of viruses tested for neutralization sensitivity using a panel of 30 South African sera. (A) Serum neutralization potency as measured by GMT, over the 30 sera/plasma included in this study; sera below the threshold of detection (dilutions of 1:20 was the limit tested) were given the value of 10. The two subgroups evident among the pre-seroconversion viruses did not cluster phylogenetically. One-sided Wilcoxon rank sum test employed with median values shown in red and interquartile ranges in black (B) Neutralization breadth per infection stage against 30 clade C serum samples measured as the percentage of viruses neutralized at ID50 > 1:20. Three very sensitive viruses, two tier 1A (SO032_A2.8–1, CH0505.w4.3) and one tier 1B, (6644.v2.c33), were excluded from the analysis. (C), (D) V1V2 loop amino acid length variation and glycan density per infection stage. Mann-Whitney two-sided tests used in panel B, C and D, with median values shown in red and interquartile ranges in black. Uncorrected p-values <0.05 are provided, however as four comparisons were made, only p-values <0.015 should be considered significant.
Fig 5
Fig 5. Role of the glycan at position 332 (N332+) in influencing neutralization susceptibility of clade C viruses.
Each point represents the geometric mean of viruses tested for neutralization sensitivity using either bnAbs (A) or a panel of 30 South African sera (B and C). (A) Comparison of neutralization sensitivity of clade C viruses to bnAbs VRC01, PG9, PGT128, CAP256-VRC26.25 and 4E10. The highest concentration tested for each bnAb and the percentage of viruses neutralized (breadth) are indicated. Env pseudotyped clade C viruses (n = 139), from single infections for which SGA-derived sequences were available, were partitioned into three infection stage groups per sequential gain of HIV-1 specific antibody responses as a marker of time from infection; pre-seroconversion (Ab-), indeterminate (Ab-/+) and post-seroconversion (Ab+). Throughout, pre-seroconversion viruses are indicated in blue, with indeterminate in grey and post-seroconversion in red. Significant differences between medians indicated with the relevant p-value for a two-sided Mann-Whitney test. (B) Comparison of glycan frequency changes between pre-seroconversion (Ab-) and post-seroconversion (Ab+) infection stages for six sites comprising the glycan patch [57]. N-linked glycans were predicted according to the Nx(T/S) sequon, where x is not a proline. (C) Comparison of neutralization sensitivity between viruses categorized into those containing N332+ (n = 94), those with N334+ (n = 22) and those without a glycan at either position 332 or 334 (n = 21). Significance tested and shown with p-values provided for a Mann-Whitney, two-sided test. (D) A comparison of susceptibility using only viruses containing the N332 glycan, per infection stage. Dot plots show medians in red horizontal lines and interquartile ranges in black lines. Significance tested by non-parametric two-sided Mann-Whitney tests. Uncorrected p-values are provided.
Fig 6
Fig 6. Diversification of the southern African clade C epidemic, over a period spanning 1998–2010, is associated with increased neutralization resistance.
(A) Gp160 unrooted maximum likelihood phylogeny (PhymML) of protein sequences with sites greater than 5% gaps excluded, thereby disregarding hypervariable regions. Branches are colored according to sampling year category which was preselected based on numbers; warmer colors denoting earlier collected samples and cooler colors denoting samples collected later in the epidemic. (B) Protein ML phylogeny derived distances, estimated as branch lengths from root using the minimum sum of variance, correlated over time with calendar year. (C) Diversification (measured as branch length from root using the minimum sum of variance) inversely correlated with serum neutralization sensitivity. Rank correlations were performed using Kendall's rank correlation tau test. (D) Increasing resistance to antibody (bnAb) neutralization over the course of the clade C epidemic. bnAb susceptibility of clade C viruses from three distinct periods preselected based on numbers, 1998 to 2005 (n = 75), 2006 to 2007 (n = 55) and 2008 to 2010 (n = 70) tested against five bnAbs, VRC01, PG9, CAP256-VRC26.25, PGT128 and 4E10. The highest concentration tested for each bnAb and the percentage of viruses neutralized (breadth) are indicated. Placeholder constants of 50 μg/ml used for IC50 >50 μg/ml (4E10), 10 μg/ml used for IC50 >10 μg/ml (VRC01, PG9 and PGT128) and 25 μg/ml used for IC50 >25 μg/ml (CAP256-VRC26.25). Box plots show representative IC50 titer distributions for each bnAb tested across each period with median IC50 represented by horizontal lines. Differences of neutralization sensitivity between viruses over calendar time were evaluated using the Jonckheere-Terpstra test for trend. Assays using starting concentrations of 10μg/ml were used for VRC01 data reported here.
Fig 7
Fig 7. bnAb VRC01 coverage against clade C pseudoviruses viruses.
Potency-breadth curves are presented for both IC50 in red and IC80 titers in blue. Dashed vertical lines indicate concentrations of 50 ug/ml, 10 ug/ml and 1 ug/ml tested. Assays using starting concentrations of 50μg/ml were used for VRC01 data reported here.
Fig 8
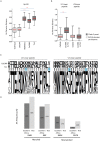
Fig 8. Relationship of clade C acute/early panel env genes/envelope proteins (n = 200) to clade C candidate vaccine strains compared to the relationship of CRF01_AE breakthrough viruses from RV144 (n = 66 placebo arm) to the RV144 vaccine.
(A) Gp120 amino acid distances (excluding signal peptide) for clade C viruses to clade-matched vaccine prime- and boost-strains (96ZM651, TV1 and Ce1086); and CRF01_AE viruses from breakthrough infections in the placebo arm of RV144 to clade-matched RV144 vaccine strains (92TH023 and CM244). Box plots for RV144 distances in light grey and clade C distances in dark grey, with means in red. Significance shown in p-values provided for a two-sided Mann-Whitney test. (B) Amino acid distances across V2 (HXB2 161–179) and V3 (HXB2 300–322) linear B cell epitopes for clade C viruses as well as for RV144 placebo CRF01_AE viruses to respective clade-matched vaccine protein boost strains, Ce1086 and TV1 and CM244. Significance shown in p-values provided for a two-sided Mann-Whitney test. (C) Logo conservation plots across V2 and V3 linear B cell epitope peptides which includes vaccine signature sites as identified in RV144 [11,13]. These illustrate clade C acute/early panel sequence amino acid frequency and corresponding vaccine strain residue conservation. Residues shared between clade C and either vaccine strain Ce1086 or TV1 are shown in black with the remaining residues in grey. Positions of RV144 identified signatures associated with reduced infection risk K169, I181X, I307 and F317X are shaded in blue. (D) Comparison of RV144 signature site frequencies in acute/early clade C panel (southern Africa) compared to Thai CRF01_AE sequences from the placebo arm (Thai). In RV144, a match to the vaccine at position 169 (with a K) and at 307 (with I) was associated with protection; while a mismatch to the vaccine at positions 181 (I181X) and 317 (F317X) was associated with protection [11,13].

Similar articles

Cited by

References

    1. Ledgerwood JE, Coates EE, Yamshchikov G, Saunders JG, Holman L, Enama ME, et al. Safety, pharmacokinetics and neutralization of the broadly neutralizing HIV-1 human monoclonal antibody VRC01 in healthy adults. Clin Exp Immunol. 2015; 1–23. 10.1111/cei.12692 - DOI - PMC - PubMed
    1. Derdeyn C a, Decker JM, Bibollet-Ruche F, Mokili JL, Muldoon M, Denham S a, et al. Envelope-constrained neutralization-sensitive HIV-1 after heterosexual transmission. Science. 2004;303: 2019–22. 10.1126/science.1093137 - DOI - PubMed
    1. Keele BF, Giorgi EE, Salazar-Gonzalez JF, Decker JM, Pham KT, Salazar MG, et al. Identification and characterization of transmitted and early founder virus envelopes in primary HIV-1 infection. Proc Natl Acad Sci U S A. 2008;105: 7552–7. 10.1073/pnas.0802203105 - DOI - PMC - PubMed
    1. Abrahams M-R, Anderson JA, Giorgi EE, Seoighe C, Mlisana K, Ping L-H, et al. Quantitating the multiplicity of infection with human immunodeficiency virus type 1 subtype C reveals a non-poisson distribution of transmitted variants. J Virol. 2009;83: 3556–67. 10.1128/JVI.02132-08 - DOI - PMC - PubMed
    1. Wilen CB, Parrish NF, Pfaff JM, Decker JM, Henning E a, Haim H, et al. Phenotypic and immunologic comparison of clade B transmitted/founder and chronic HIV-1 envelope glycoproteins. J Virol. 2011;85: 8514–27. 10.1128/JVI.00736-11 - DOI - PMC - PubMed