. 2016 Aug 2;24(8):1292-1300.
doi: 10.1016/j.str.2016.06.004. Epub 2016 Jul 14.

Active Control of Repetitive Structural Transitions between Replication Forks and Holliday Junctions by Werner Syndrome Helicase

Affiliations

Active Control of Repetitive Structural Transitions between Replication Forks and Holliday Junctions by Werner Syndrome Helicase

Soochul Shin et al. Structure. .

Abstract

The reactivation of stalled DNA replication via fork regression invokes Holliday junction formation, branch migration, and the recovery of the replication fork after DNA repair or error-free DNA synthesis. The coordination mechanism for these DNA structural transitions by molecular motors, however, remains unclear. Here we perform single-molecule fluorescence experiments with Werner syndrome protein (WRN) and model replication forks. The Holliday junction is readily formed once the lagging arm is unwound, and migrated unidirectionally with 3.2 ± 0.03 bases/s velocity. The recovery of the replication fork was controlled by branch migration reversal of WRN, resulting in repetitive fork regression. The Holliday junction formation, branch migration, and migration direction reversal are all ATP dependent, revealing that WRN uses the energy of ATP hydrolysis to actively coordinate the structural transitions of DNA.

Keywords: replication fork regression; single-molecule FRET; werner syndrome helicase.


Figures

Figure 1
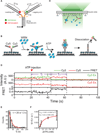
Figure 1. Experimental Scheme
(A) The design of a model replication fork. Orange lines represent heterologous bases. (B) Experimental Procedures: (from left to right) immobilization of model replication forks, incubation with WRN (26 nM), flushing out of free WRN, initiation of fork regression by the delivery of imaging buffer containing ATP-Mg2+, and dissociation of the daughter duplex upon completion of fork regression. (C) Scheme of single-molecule total internal reflection fluorescence microscopy. (D) Example fluorescence intensity time traces of Cy3 (green) and Cy5 (red) at Cy3 excitation (top), that of Cy5 at Cy5 excitation (middle), and corresponding FRET time traces (bottom). Three events: ATP-Mg2+ injection, formation of a four-way junction, and dissociation of daughter strands are indicated by dashed lines. Time delays between the events are defined as τf and τd, as indicated. (E) Distribution of τf in the presence of 1 mM ATP-Mg2+. The red line indicates a fit to a single-exponential function. (F) ATP dependency of the four-way junction formation time. The inverse of average τf, <τf>, is plotted as a function of ATP concentration. Error bars are SD of three values obtained by averaging a dataset consisting of n > 30 data points, and each dataset was obtained at the same ATP concentrations but from independent measurements. The red line represents a fit to the Michaelis-Menten function. See also Figure S1.
Figure 2
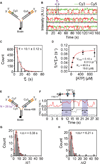
Figure 2. Unwinding of the Lagging Arm as a Rate-Limiting Step for the Formation of a Holliday Junction
(A) Single-molecule three-color FRET experiment to observe the correlation between the lagging arm unwinding and the four-way junction formation. Left: sample structure. Right: example intensity time traces of Cy3 (green), Cy5 (red), and Cy7 (gray) at Cy5 excitation (top) and Cy3 excitation (bottom). The unwinding time, τu, is defined as a time delay between the injection of 1 mM ATP-Mg2+ and the initiation of the lagging arm unwinding. (B) Correlation plot of τf and τu. For clear visualization, each data point is represented as a gray-scaled 2D Gaussian distribution, and a contour plot of the population density is overlaid on the distribution. The red line is a linear function: y = x. (C) Dwell time histogram of τd in the presence of 1 mM ATP-Mg2+. The red line represents a best fit to gamma distribution. Gamma distribution fitting with varying n values is shown in different colors. (D) ATP dependency of the duration of a four-way junction. The inverse of average τd, <τd>, is plotted as a function of ATP concentration. Error bars are SD of three values obtained by averaging a dataset consisting of n > 30 data points, and each dataset obtained at the same ATP concentrations but from independent measurements. The red line represents a fit to the Michaelis-Menten function. See also Figure S2.
Figure 3
Figure 3. Branch Migration Speed
Length dependency of τd. Left: a series of model replication forks with FRET probes at different distances from the ends of the leading and lagging arms. The distance (N) means that Cy5 is labeled at the Nth base from the 5′ end of the leading daughter strand. The difference between Cy3 and Cy5 labeling positions is less than 3 nt. Right: <τd> at varying N. Error bars are SD of three values obtained by averaging a dataset consisting of n > 30 data points, and each dataset obtained from the same fork sample but independent measurement. The red line is a linear fit of the data with zero y-intercept. Orange lines represent heterologous bases. See also Figure S2.
Figure 4
Figure 4. Repetitive Fork Regression of WRN
(A) Sample structure. Heterologous regions (15 bp) are added at the end of the leading and lagging arms (thick orange lines). (B) Representative intensity time traces of Cy3 (green) and Cy5 (red) in the presence of 1 mM ATP-Mg2+. The reversal time, τr, is defined as the high FRET dwell time. (C) Distribution of τr in the presence of 1 mM ATP-Mg2+. The red line represents a fit to a single-exponential function. (D) ATP dependency of the branch migration reversal time. The inverse of average τr, <τr>, is plotted as a function of ATP concentration. Error bars are SD of three values obtained by averaging a dataset consisting of n > 200 data points, and each dataset obtained from the same ATP concentration but independent measurement. The red line is a fit to a Michaelis-Menten function. (E) Sample structure for single-molecule four-color FRET experiment. (F) Representative FRET time traces of FRET1 (FRET between Alexa 488 and Cy5) and FRET2 (FRET between Cy3 and Cy7) in the presence of 1 mM ATP-Mg2+. Time delay between FRET1 and FRET2 jumps in the regression phase (Δt1, n = 66) and that between FRET2 and FRET1 drops in the recovery phase (Δt2, n = 57) are clear. (G and H) Distribution of Δt1 (G) and Δt2 (H) in the presence of 1 mM ATP-Mg2+. See also Figures S3 and S4.
Figure 5
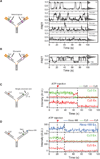
Figure 5. Branch Migration Reversal at Different DNA Structures
(A) Branch migration reversal at short heterologous sequences. Left: a cartoon of sample structures. Short heterologous sequences (purple) are introduced in the middle of the leading and lagging arms. Right: representative FRET time traces (left panels) and corresponding FRET histograms (right panels) for different lengths of the heterologous regions. Dashed lines were added as an eye-guide. The histograms were made from more than 20 molecules. (B) The same as (A) for the sample with 3-bp mismatches in the leading and lagging arms that are base-paired after fork regression. (C) Branch migration through a long single-stranded region. Left: sample structure. Right: representative fluorescence intensity time traces of Cy3 (green) and Cy5 (red) at Cy3 excitation (top) and Cy5 excitation (bottom). (D) Branch migration through a single-stranded break. Left: sample structure. Right: representative fluorescence intensity time traces of Alexa 488 (blue), Cy3 (green), and Cy5 (red) at Alexa 488 excitation (top), Cy3 excitation (middle), and Cy5 excitation (bottom). See also Figures S4 and S5.

Similar articles

Cited by

References

    1. Abbondanzieri EA, Bokinsky G, Rausch JW, Zhang JX, Le Grice SF, Zhuang X. Dynamic binding orientations direct activity of HIV reverse transcriptase. Nature. 2008;453:184–189. - PMC - PubMed
    1. Achar YJ, Balogh D, Haracska L. Coordinated protein and DNA remodeling by human HLTF on stalled replication fork. Proc. Natl. Acad. Sci. USA. 2011;108:14073–14078. - PMC - PubMed
    1. Atkinson J, McGlynn P. Replication fork reversal and the maintenance of genome stability. Nucleic Acids Res. 2009;37:3475–3492. - PMC - PubMed
    1. Betous R, Mason AC, Rambo RP, Bansbach CE, Badu-Nkansah A, Sirbu BM, Eichman BF, Cortez D. SMARCAL1 catalyzes fork regression and Holliday junction migration to maintain genome stability during DNA replication. Genes Dev. 2012;26:151–162. - PMC - PubMed
    1. Biswas I, Yamamoto A, Hsieh P. Branch migration through DNA sequence heterology. J. Mol. Biol. 1998;279:795–806. - PubMed

Publication types

MeSH terms

LinkOut - more resources