

Interspecies and Intraspecies Analysis of Trehalose Contents and the Biosynthesis Pathway Gene Family Reveals Crucial Roles of Trehalose in Osmotic-Stress Tolerance in Cassava
- PMID: 27420056
- PMCID: PMC4964453
- DOI: 10.3390/ijms17071077
Interspecies and Intraspecies Analysis of Trehalose Contents and the Biosynthesis Pathway Gene Family Reveals Crucial Roles of Trehalose in Osmotic-Stress Tolerance in Cassava
Abstract
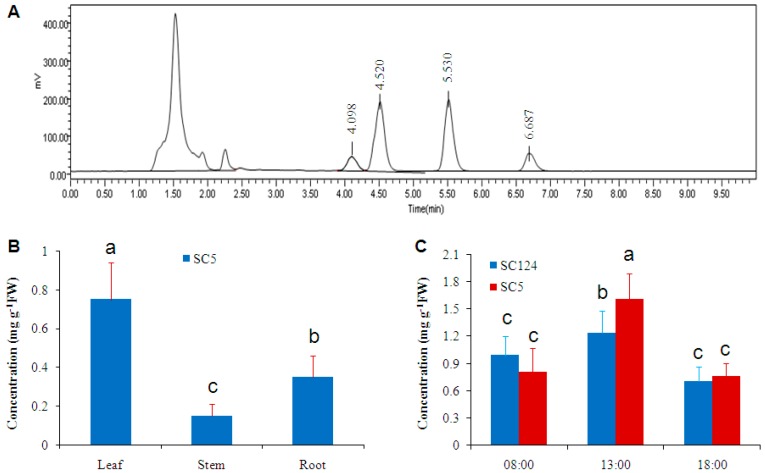
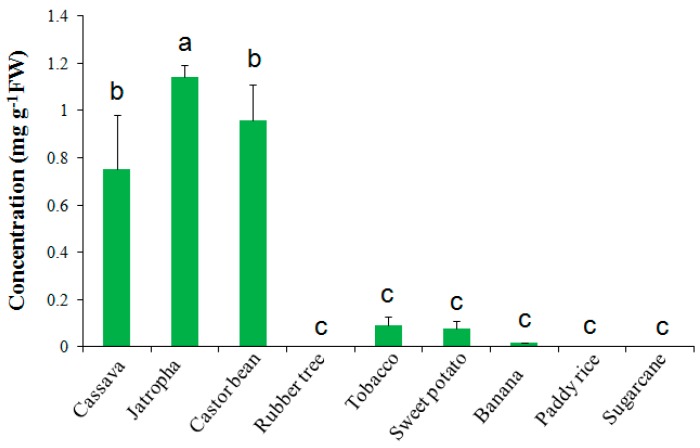
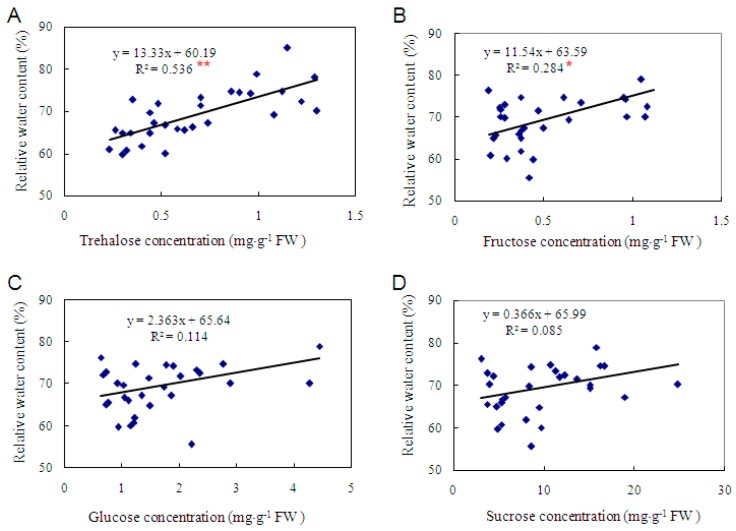
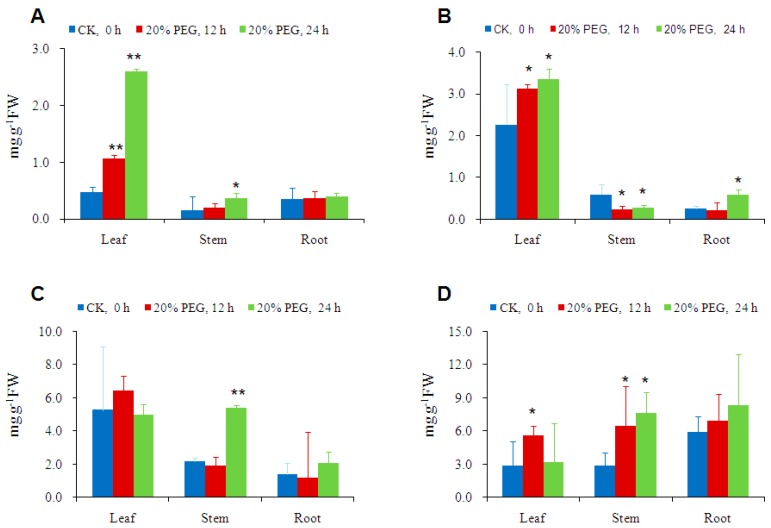
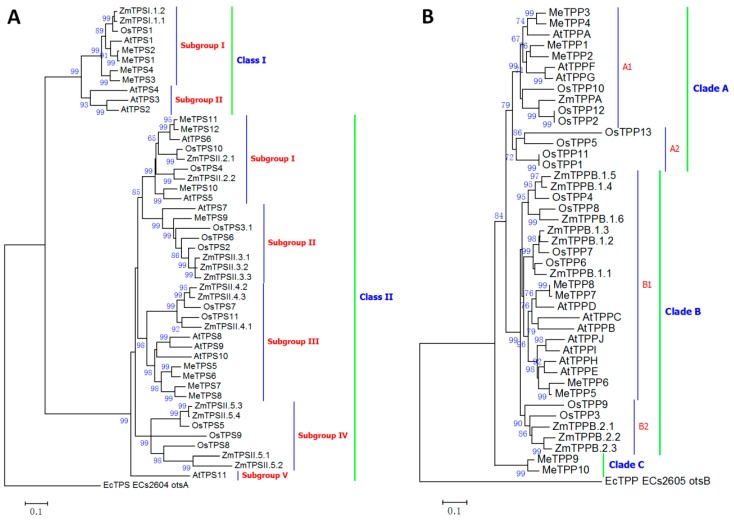
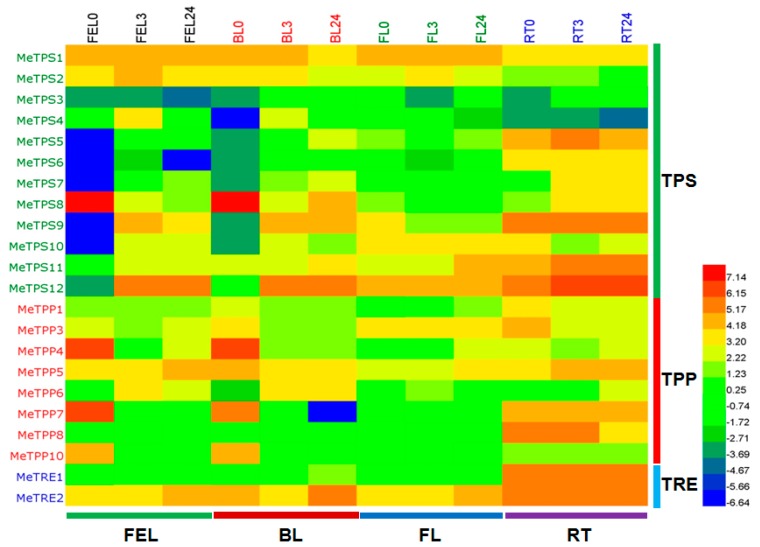
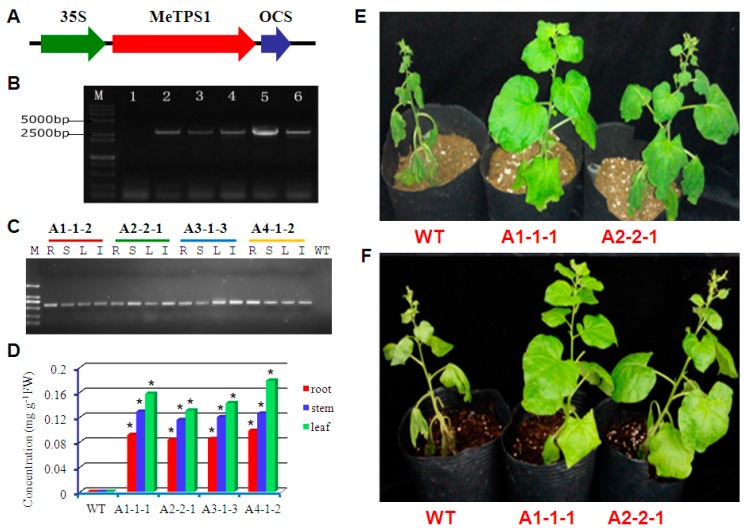
Trehalose is a nonreducing α,α-1,1-disaccharide in a wide range of organisms, and has diverse biological functions that range from serving as an energy source to acting as a protective/signal sugar. However, significant amounts of trehalose have rarely been detected in higher plants, and the function of trehalose in the drought-tolerant crop cassava (Manihot esculenta Crantz) is unclear. We measured soluble sugar concentrations of nine plant species with differing levels of drought tolerance and 41 cassava varieties using high-performance liquid chromatography with evaporative light-scattering detector (HPLC-ELSD). Significantly high amounts of trehalose were identified in drought-tolerant crops cassava, Jatropha curcas, and castor bean (Ricinus communis). All cassava varieties tested contained high amounts of trehalose, although their concentrations varied from 0.23 to 1.29 mg·g(-1) fresh weight (FW), and the trehalose level was highly correlated with dehydration stress tolerance of detached leaves of the varieties. Moreover, the trehalose concentrations in cassava leaves increased 2.3-5.5 folds in response to osmotic stress simulated by 20% PEG 6000. Through database mining, 24 trehalose pathway genes, including 12 trehalose-6-phosphate synthases (TPS), 10 trehalose-6-phosphate phosphatases (TPP), and two trehalases were identified in cassava. Phylogenetic analysis indicated that there were four cassava TPS genes (MeTPS1-4) that were orthologous to the solely active TPS gene (AtTPS1 and OsTPS1) in Arabidopsis and rice, and a new TPP subfamily was identified in cassava, suggesting that the trehalose biosynthesis activities in cassava had potentially been enhanced in evolutionary history. RNA-seq analysis indicated that MeTPS1 was expressed at constitutionally high level before and after osmotic stress, while other trehalose pathway genes were either up-regulated or down-regulated, which may explain why cassava accumulated high level of trehalose under normal conditions. MeTPS1 was then transformed into tobacco (Nicotiana benthamiana). Results indicated that transgenic tobacco lines accumulated significant level of trehalose and possessed improved drought stress tolerance. In conclusion, cassava accumulated significantly high amount of trehalose under normal conditions due to multiplied trehalose biosynthesis gene families and constant expression of the active MeTPS1 gene. High levels of trehalose subsequently contributed to high drought stress tolerance.
Keywords: HPLC-ELSD; Manihot esculenta; RNA-seq; abiotic stress; drought tolerance; phylogenetic analysis; trehalase.
Figures
Similar articles
-
Expression patterns of members of the ethylene signaling-related gene families in response to dehydration stresses in cassava.PLoS One. 2017 May 23;12(5):e0177621. doi: 10.1371/journal.pone.0177621. eCollection 2017. PLoS One. 2017. PMID: 28542282 Free PMC article.
-
Involvement of abscisic acid-responsive element-binding factors in cassava (Manihot esculenta) dehydration stress response.Sci Rep. 2019 Sep 2;9(1):12661. doi: 10.1038/s41598-019-49083-3. Sci Rep. 2019. PMID: 31477771 Free PMC article.
-
Physiological Investigation and Transcriptome Analysis of Polyethylene Glycol (PEG)-Induced Dehydration Stress in Cassava.Int J Mol Sci. 2016 Feb 25;17(3):283. doi: 10.3390/ijms17030283. Int J Mol Sci. 2016. PMID: 26927071 Free PMC article.
-
Trehalose biosynthesis in response to abiotic stresses.J Integr Plant Biol. 2008 Oct;50(10):1223-9. doi: 10.1111/j.1744-7909.2008.00736.x. J Integr Plant Biol. 2008. PMID: 19017109 Review.
-
Cassava biology and physiology.Plant Mol Biol. 2004 Nov;56(4):481-501. doi: 10.1007/s11103-005-2270-7. Plant Mol Biol. 2004. PMID: 15669146 Review.
Cited by
-
The Role of Trehalose 6-Phosphate in Crop Yield and Resilience.Plant Physiol. 2018 May;177(1):12-23. doi: 10.1104/pp.17.01634. Epub 2018 Mar 28. Plant Physiol. 2018. PMID: 29592862 Free PMC article. Review.
-
Characteristics and Expression Analyses of Trehalose-6-Phosphate Synthase Family in Prunus mume Reveal Genes Involved in Trehalose Biosynthesis and Drought Response.Biomolecules. 2020 Sep 23;10(10):1358. doi: 10.3390/biom10101358. Biomolecules. 2020. PMID: 32977584 Free PMC article.
-
Trehalose-6-phosphate phosphatase E modulates ABA-controlled root growth and stomatal movement in Arabidopsis.J Integr Plant Biol. 2020 Oct;62(10):1518-1534. doi: 10.1111/jipb.12925. Epub 2020 Apr 16. J Integr Plant Biol. 2020. PMID: 32167237 Free PMC article.
-
Application of Trehalose and Salicylic Acid Mitigates Drought Stress in Sweet Basil and Improves Plant Growth.Plants (Basel). 2021 May 27;10(6):1078. doi: 10.3390/plants10061078. Plants (Basel). 2021. PMID: 34072096 Free PMC article.
-
A Chromosome-level Genome Assembly of Wild Castor Provides New Insights into its Adaptive Evolution in Tropical Desert.Genomics Proteomics Bioinformatics. 2022 Feb;20(1):42-59. doi: 10.1016/j.gpb.2021.04.003. Epub 2021 Jul 30. Genomics Proteomics Bioinformatics. 2022. PMID: 34339842 Free PMC article.
References
-
- Westerbergh A., Zhang J., Sun C. Cassava: A multi-purpose crop for the future. In: Pace C.M., editor. Cassava: Farming, Uses, and Economic Impact. Nova Science Publishers, Inc.; New York, NY, USA: 2011. pp. 145–163.
-
- Jansson C., Westerbergh A., Zhang J., Sun C. Cassava, a potential biofuel crop in China. Appl. Energy. 2009;86:95–99. doi: 10.1016/j.apenergy.2009.05.011. - DOI
-
- El-Sharkawy M.A. Physiological characteristics of cassava tolerance to prolonged drought in the tropics: Implications for breeding cultivars adapted to seasonally dry and semiarid environments. Braz. J. Plant Physiol. 2007;19:257–286. doi: 10.1590/S1677-04202007000400003. - DOI
MeSH terms
Substances
LinkOut - more resources
Full Text Sources
Other Literature Sources
Molecular Biology Databases
