

A Statistical Guide to the Design of Deep Mutational Scanning Experiments
- PMID: 27412710
- PMCID: PMC5012406
- DOI: 10.1534/genetics.116.190462
A Statistical Guide to the Design of Deep Mutational Scanning Experiments
Abstract
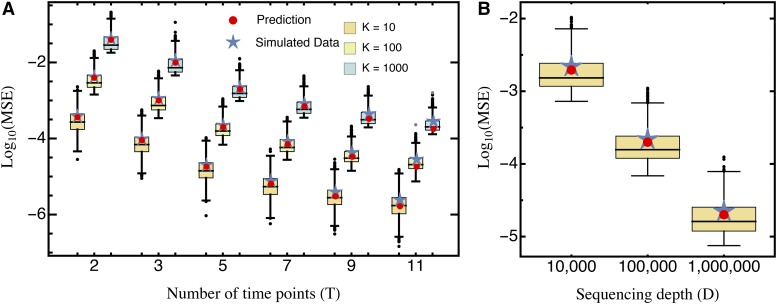
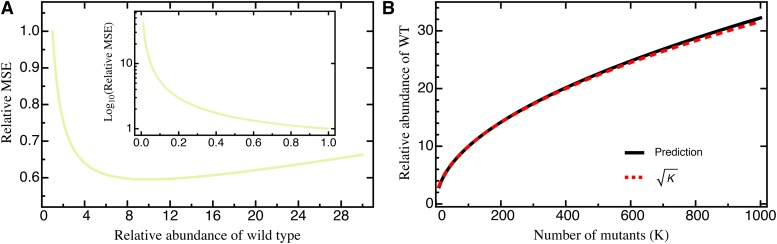
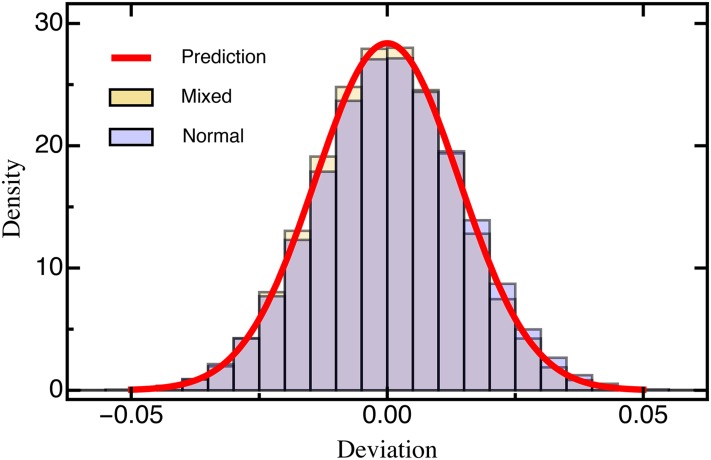
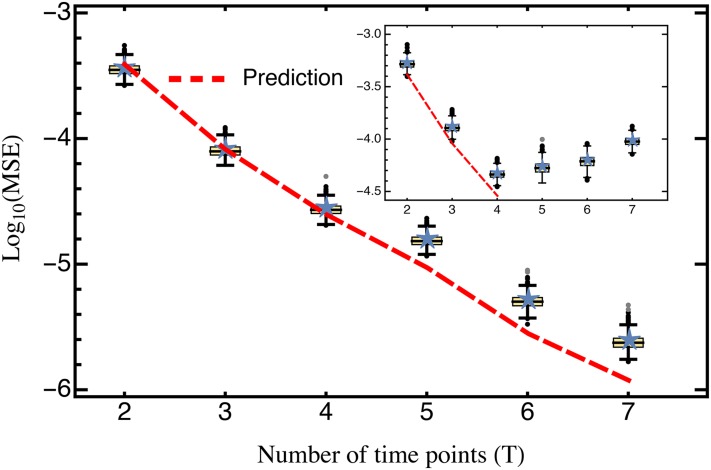
The characterization of the distribution of mutational effects is a key goal in evolutionary biology. Recently developed deep-sequencing approaches allow for accurate and simultaneous estimation of the fitness effects of hundreds of engineered mutations by monitoring their relative abundance across time points in a single bulk competition. Naturally, the achievable resolution of the estimated fitness effects depends on the specific experimental setup, the organism and type of mutations studied, and the sequencing technology utilized, among other factors. By means of analytical approximations and simulations, we provide guidelines for optimizing time-sampled deep-sequencing bulk competition experiments, focusing on the number of mutants, the sequencing depth, and the number of sampled time points. Our analytical results show that sampling more time points together with extending the duration of the experiment improves the achievable precision disproportionately compared with increasing the sequencing depth or reducing the number of competing mutants. Even if the duration of the experiment is fixed, sampling more time points and clustering these at the beginning and the end of the experiment increase experimental power and allow for efficient and precise assessment of the entire range of selection coefficients. Finally, we provide a formula for calculating the 95%-confidence interval for the measurement error estimate, which we implement as an interactive web tool. This allows for quantification of the maximum expected a priori precision of the experimental setup, as well as for a statistical threshold for determining deviations from neutrality for specific selection coefficient estimates.
Keywords: distribution of fitness effects; experimental design; experimental evolution; mutation; population genetics.
Copyright © 2016 by the Genetics Society of America.
Figures
Similar articles
-
Software for the analysis and visualization of deep mutational scanning data.BMC Bioinformatics. 2015 May 20;16:168. doi: 10.1186/s12859-015-0590-4. BMC Bioinformatics. 2015. PMID: 25990960 Free PMC article.
-
Deep Mutational Scanning: Library Construction, Functional Selection, and High-Throughput Sequencing.Cold Spring Harb Protoc. 2015 Aug 3;2015(8):777-80. doi: 10.1101/pdb.prot085225. Cold Spring Harb Protoc. 2015. PMID: 26240405
-
DiMSum: an error model and pipeline for analyzing deep mutational scanning data and diagnosing common experimental pathologies.Genome Biol. 2020 Aug 17;21(1):207. doi: 10.1186/s13059-020-02091-3. Genome Biol. 2020. PMID: 32799905 Free PMC article.
-
Causes of natural variation in fitness: evidence from studies of Drosophila populations.Proc Natl Acad Sci U S A. 2015 Feb 10;112(6):1662-9. doi: 10.1073/pnas.1423275112. Epub 2015 Jan 8. Proc Natl Acad Sci U S A. 2015. PMID: 25572964 Free PMC article. Review.
-
Rational Protein Engineering Guided by Deep Mutational Scanning.Int J Mol Sci. 2015 Sep 23;16(9):23094-110. doi: 10.3390/ijms160923094. Int J Mol Sci. 2015. PMID: 26404267 Free PMC article. Review.
Cited by
-
The Adaptive Potential of the Middle Domain of Yeast Hsp90.Mol Biol Evol. 2021 Jan 23;38(2):368-379. doi: 10.1093/molbev/msaa211. Mol Biol Evol. 2021. PMID: 32871012 Free PMC article.
-
Facilitating Machine Learning-Guided Protein Engineering with Smart Library Design and Massively Parallel Assays.Adv Genet (Hoboken). 2021 Dec 7;2(4):2100038. doi: 10.1002/ggn2.202100038. eCollection 2021 Dec. Adv Genet (Hoboken). 2021. PMID: 36619853 Free PMC article.
-
A statistical framework for analyzing deep mutational scanning data.Genome Biol. 2017 Aug 7;18(1):150. doi: 10.1186/s13059-017-1272-5. Genome Biol. 2017. PMID: 28784151 Free PMC article.
-
The power of multiplexed functional analysis of genetic variants.Nat Protoc. 2016 Oct;11(10):1782-7. doi: 10.1038/nprot.2016.135. Epub 2016 Sep 1. Nat Protoc. 2016. PMID: 27583640 Free PMC article.
-
MBE: model-based enrichment estimation and prediction for differential sequencing data.Genome Biol. 2023 Oct 2;24(1):218. doi: 10.1186/s13059-023-03058-w. Genome Biol. 2023. PMID: 37784130 Free PMC article.
References
MeSH terms
LinkOut - more resources
Full Text Sources
Other Literature Sources
