Chronic hyperglycemia induced via the heterozygous knockout of Pdx1 worsens neuropathological lesion in an Alzheimer mouse model
- PMID: 27406855
- PMCID: PMC4942607
- DOI: 10.1038/srep29396
Chronic hyperglycemia induced via the heterozygous knockout of Pdx1 worsens neuropathological lesion in an Alzheimer mouse model
Abstract
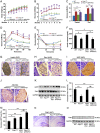
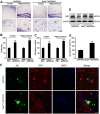
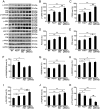
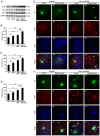
Compelling evidence has indicated that dysregulated glucose metabolism links Alzheimer's disease (AD) and diabetes mellitus (DM) via glucose metabolic products. Nevertheless, because of the lack of appropriate animal models, whether chronic hyperglycemia worsens AD pathologies in vivo remains to be confirmed. Here, we crossed diabetic mice (Pdx1(+/-) mice) with Alzheimer mice (APP/PS1 transgenic mice) to generate Pdx1(+/-)/APP/PS1. We identified robust increases in tau phosphorylation, the loss of the synaptic spine protein, amyloid-β (Aβ) deposition and plaque formation associated with increased microglial and astrocyte activation proliferation, which lead to exacerbated memory and cognition deficits. More importantly, we also observed increased glucose intolerance accompanied by Pdx1 reduction, the formation of advanced glycation end-products (AGEs), and the activation of the receptor for AGEs (RAGE) signaling pathways during AD progression; these changes are thought to contribute to the processing of Aβ precursor proteins and result in increased Aβ generation and decreased Aβ degradation. Protein glycation, increased oxidative stress and inflammation via hyperglycemia are the primary mechanisms involved in the pathophysiology of AD. These results indicate the pathological relationship between these diseases and provide novel insights suggesting that glycemic control may be beneficial for decreasing the incidence of AD in diabetic patients and delaying AD progression.
Figures


Similar articles
-
CART mitigates oxidative stress and DNA damage in memory deficits of APP/PS1 mice via upregulating β‑amyloid metabolism‑associated enzymes.Mol Med Rep. 2021 Apr;23(4):280. doi: 10.3892/mmr.2021.11919. Epub 2021 Feb 19. Mol Med Rep. 2021. PMID: 33604684 Free PMC article.
-
Long-term treadmill exercise attenuates Aβ burdens and astrocyte activation in APP/PS1 mouse model of Alzheimer's disease.Neurosci Lett. 2018 Feb 14;666:70-77. doi: 10.1016/j.neulet.2017.12.025. Epub 2017 Dec 12. Neurosci Lett. 2018. PMID: 29246793
-
Chronic diabetic states worsen Alzheimer neuropathology and cognitive deficits accompanying disruption of calcium signaling in leptin-deficient APP/PS1 mice.Oncotarget. 2017 Jul 4;8(27):43617-43634. doi: 10.18632/oncotarget.17116. Oncotarget. 2017. PMID: 28467789 Free PMC article.
-
AGE-RAGE stress: a changing landscape in pathology and treatment of Alzheimer's disease.Mol Cell Biochem. 2019 Sep;459(1-2):95-112. doi: 10.1007/s11010-019-03553-4. Epub 2019 May 11. Mol Cell Biochem. 2019. PMID: 31079281 Review.
-
Preventing activation of receptor for advanced glycation endproducts in Alzheimer's disease.Curr Drug Targets CNS Neurol Disord. 2005 Jun;4(3):249-66. doi: 10.2174/1568007054038210. Curr Drug Targets CNS Neurol Disord. 2005. PMID: 15975028 Review.
Cited by
-
High glucose induces formation of tau hyperphosphorylation via Cav-1-mTOR pathway: A potential molecular mechanism for diabetes-induced cognitive dysfunction.Oncotarget. 2017 Jun 20;8(25):40843-40856. doi: 10.18632/oncotarget.17257. Oncotarget. 2017. PMID: 28489581 Free PMC article.
-
Diabetes: Risk factor and translational therapeutic implications for Alzheimer's disease.Eur J Neurosci. 2022 Nov;56(9):5727-5757. doi: 10.1111/ejn.15619. Epub 2022 Feb 23. Eur J Neurosci. 2022. PMID: 35128745 Free PMC article.
-
MALAT1 Regulated mTOR-Mediated Tau Hyperphosphorylation by Acting as a ceRNA of miR144 in Hippocampus Cells Exposed to High Glucose.Clin Interv Aging. 2021 Jun 22;16:1185-1191. doi: 10.2147/CIA.S304827. eCollection 2021. Clin Interv Aging. 2021. PMID: 34188461 Free PMC article.
-
Intake of flavonoids from Astragalus membranaceus ameliorated brain impairment in diabetic mice via modulating brain-gut axis.Chin Med. 2022 Feb 12;17(1):22. doi: 10.1186/s13020-022-00578-8. Chin Med. 2022. PMID: 35151348 Free PMC article.
-
The Interplay between Diabetes and Alzheimer's Disease-In the Hunt for Biomarkers.Int J Mol Sci. 2020 Apr 15;21(8):2744. doi: 10.3390/ijms21082744. Int J Mol Sci. 2020. PMID: 32326589 Free PMC article. Review.
References
-
- Xu W., Qiu C., Winblad B. & Fratiglioni L. The effect of borderline diabetes on the risk of dementia and Alzheimer’s disease. Diabetes 56, 211–216 (2007). - PubMed
-
- Alafuzoff I., Aho L., Helisalmi S., Mannermaa A. & Soininen H. Beta-amyloid deposition in brains of subjects with diabetes. Neuropathol Appl Neurobiol 35, 60–68 (2009). - PubMed
-
- Valente T., Gella A., Fernandez-Busquets X., Unzeta M. & Durany N. Immunohistochemical analysis of human brain suggests pathological synergism of Alzheimer’s disease and diabetes mellitus. in Neurobiol Dis, Vol. 37, 67–76 (2010). - PubMed
Publication types
MeSH terms
Substances
LinkOut - more resources
Full Text Sources
Other Literature Sources
Medical
Molecular Biology Databases

