

A compendium of temperature responses of Rubisco kinetic traits: variability among and within photosynthetic groups and impacts on photosynthesis modeling
- PMID: 27406782
- PMCID: PMC5014154
- DOI: 10.1093/jxb/erw267
A compendium of temperature responses of Rubisco kinetic traits: variability among and within photosynthetic groups and impacts on photosynthesis modeling
Abstract
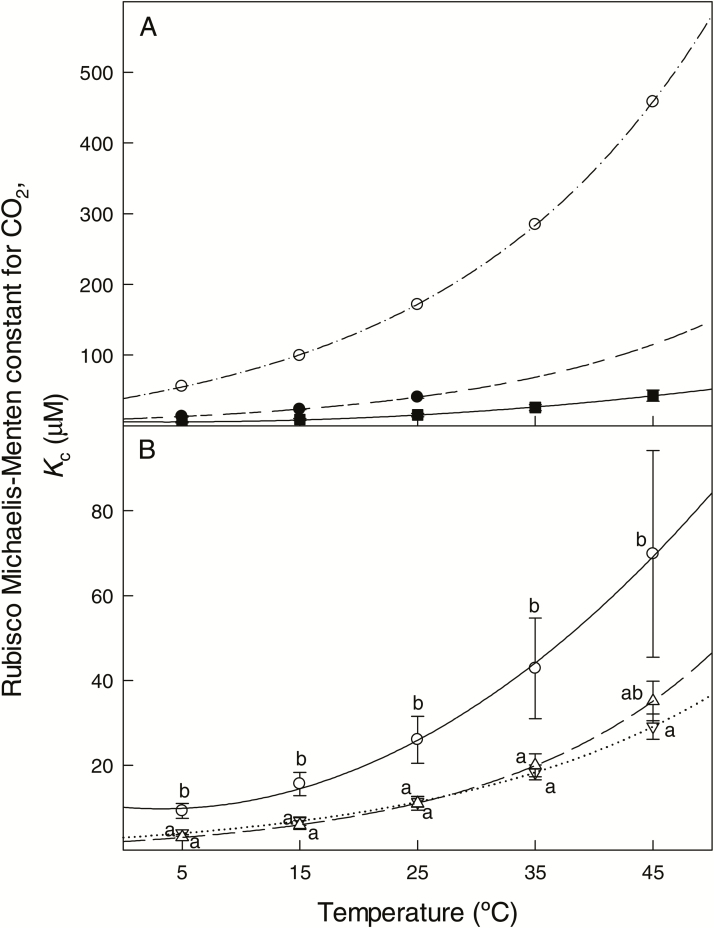
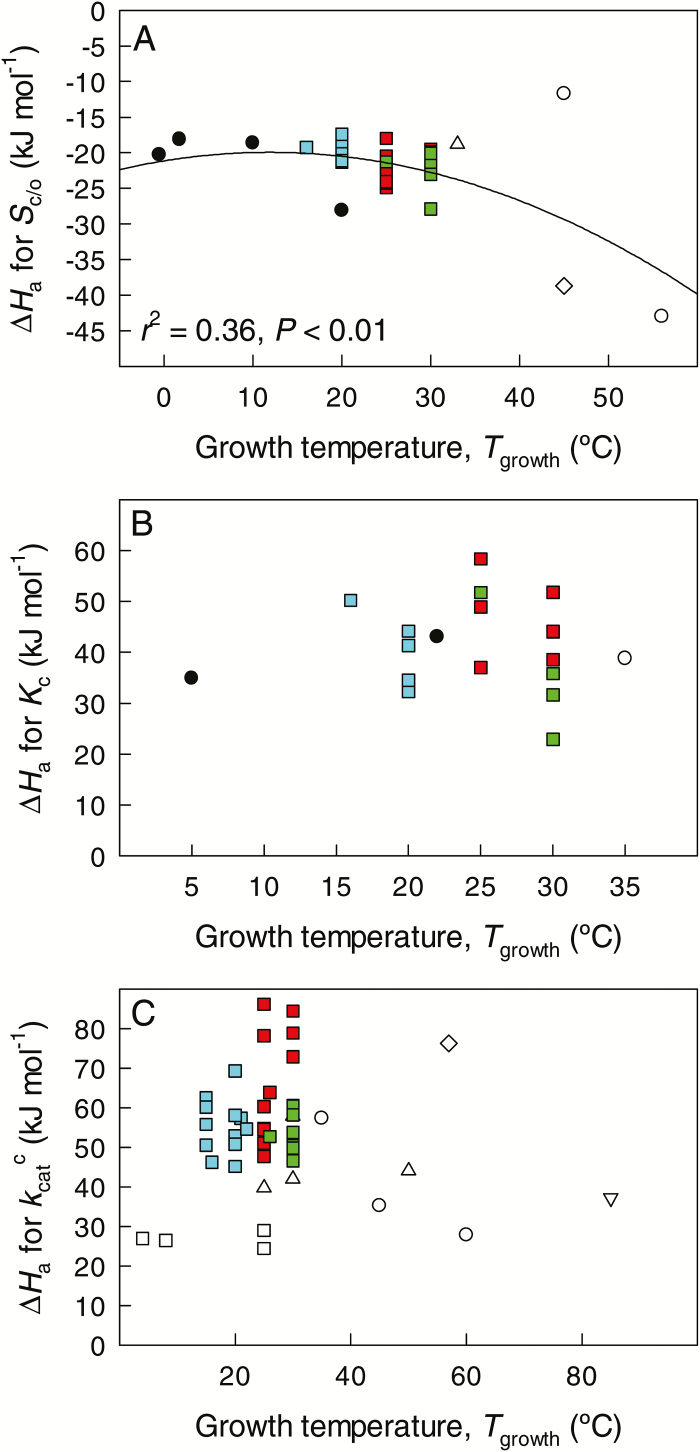
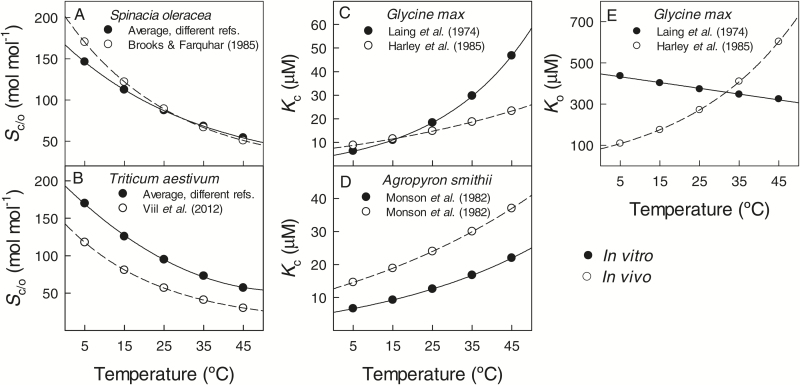
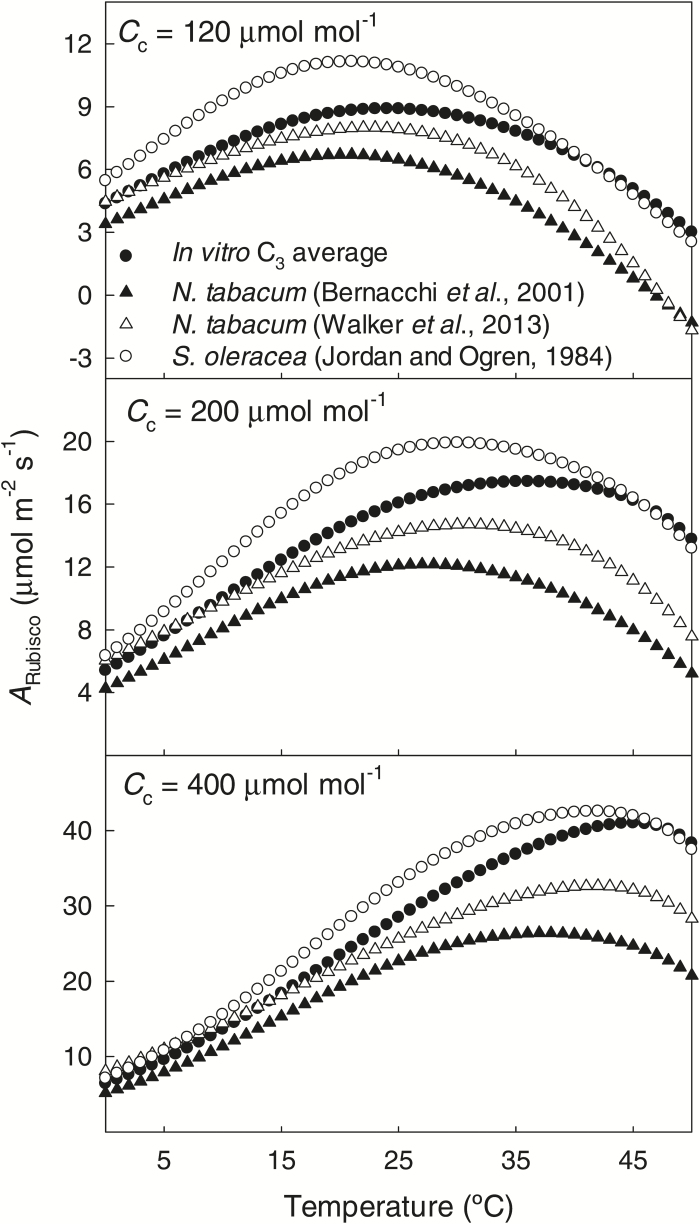
The present study provides a synthesis of the in vitro and in vivo temperature responses of Rubisco Michaelis-Menten constants for CO2 (Kc) and O2 (Ko), specificity factor (Sc,o) and maximum carboxylase turnover rate (kcatc) for 49 species from all the main photosynthetic kingdoms of life. Novel correction routines were developed for in vitro data to remove the effects of study-to-study differences in Rubisco assays. The compilation revealed differences in the energy of activation (∆Ha) of Rubisco kinetics between higher plants and other photosynthetic groups, although photosynthetic bacteria and algae were under-represented and very few species have been investigated so far. Within plants, the variation in Rubisco temperature responses was related to species' climate and photosynthetic mechanism, with differences in ∆Ha for kcatc among C3 plants from cool and warm environments, and in ∆Ha for kcatc and Kc among C3 and C4 plants. A negative correlation was observed among ∆Ha for Sc/o and species' growth temperature for all data pooled, supporting the convergent adjustment of the temperature sensitivity of Rubisco kinetics to species' thermal history. Simulations of the influence of varying temperature dependences of Rubisco kinetics on Rubisco-limited photosynthesis suggested improved photosynthetic performance of C3 plants from cool habitats at lower temperatures, and C3 plants from warm habitats at higher temperatures, especially at higher CO2 concentration. Thus, variation in Rubisco kinetics for different groups of photosynthetic organisms might need consideration to improve prediction of photosynthesis in future climates. Comparisons between in vitro and in vivo data revealed common trends, but also highlighted a large variability among both types of Rubisco kinetics currently used to simulate photosynthesis, emphasizing the need for more experimental work to fill in the gaps in Rubisco datasets and improve scaling from enzyme kinetics to realized photosynthesis.
Keywords: Activation energy; adaptation; carboxylation; meta-analysis; photosynthesis; temperature dependences..
© The Author 2016. Published by Oxford University Press on behalf of the Society for Experimental Biology.
Figures


Similar articles
-
Modelling (18)O2 and (16)O2 unidirectional fluxes in plants. III: fitting of experimental data by a simple model.Biosystems. 2013 Aug;113(2):104-14. doi: 10.1016/j.biosystems.2012.10.004. Epub 2012 Nov 13. Biosystems. 2013. PMID: 23153764
-
Temperature responses of the Rubisco maximum carboxylase activity across domains of life: phylogenetic signals, trade-offs, and importance for carbon gain.Photosynth Res. 2015 Feb;123(2):183-201. doi: 10.1007/s11120-014-0067-8. Epub 2014 Dec 17. Photosynth Res. 2015. PMID: 25515770
-
Environmentally driven evolution of Rubisco and improved photosynthesis and growth within the C3 genus Limonium (Plumbaginaceae).New Phytol. 2014 Aug;203(3):989-99. doi: 10.1111/nph.12858. Epub 2014 May 23. New Phytol. 2014. PMID: 24861241
-
Electron flow to oxygen in higher plants and algae: rates and control of direct photoreduction (Mehler reaction) and rubisco oxygenase.Philos Trans R Soc Lond B Biol Sci. 2000 Oct 29;355(1402):1433-46. doi: 10.1098/rstb.2000.0704. Philos Trans R Soc Lond B Biol Sci. 2000. PMID: 11127997 Free PMC article. Review.
-
Evolutionary trends in RuBisCO kinetics and their co-evolution with CO2 concentrating mechanisms.Plant J. 2020 Feb;101(4):897-918. doi: 10.1111/tpj.14643. Epub 2020 Jan 2. Plant J. 2020. PMID: 31820505 Review.
Cited by
-
Singular adaptations in the carbon assimilation mechanism of the polyextremophile cyanobacterium Chroococcidiopsis thermalis.Photosynth Res. 2023 May;156(2):231-245. doi: 10.1007/s11120-023-01008-y. Epub 2023 Mar 20. Photosynth Res. 2023. PMID: 36941458 Free PMC article.
-
Temperature response of Rubisco kinetics in Arabidopsis thaliana: thermal breakpoints and implications for reaction mechanisms.J Exp Bot. 2019 Jan 1;70(1):231-242. doi: 10.1093/jxb/ery355. J Exp Bot. 2019. PMID: 30403800 Free PMC article.
-
Acclimation of Biochemical and Diffusive Components of Photosynthesis in Rice, Wheat, and Maize to Heat and Water Deficit: Implications for Modeling Photosynthesis.Front Plant Sci. 2016 Nov 22;7:1719. doi: 10.3389/fpls.2016.01719. eCollection 2016. Front Plant Sci. 2016. PMID: 27920782 Free PMC article.
-
Temperature-induced changes in Arabidopsis Rubisco activity and isoform expression.J Exp Bot. 2023 Jan 11;74(2):651-663. doi: 10.1093/jxb/erac379. J Exp Bot. 2023. PMID: 36124740 Free PMC article.
-
Variation in Responses of Photosynthesis and Apparent Rubisco Kinetics to Temperature in Three Soybean Cultivars.Plants (Basel). 2019 Oct 23;8(11):443. doi: 10.3390/plants8110443. Plants (Basel). 2019. PMID: 31652868 Free PMC article.
References
-
- Atkin OK, Tjoelker MG. 2003. Thermal acclimation and the dynamic response of plant respiration to temperature. Trends in Plant Science 8, 343–351. - PubMed
-
- Azab HA, Khafagy ZA, Hassan A, El-Nady AM. 1994. Medium effect on the second-stage dissociation constant of N,N-bis(2-hydroxyethyl)glycine. Journal of Chemical and Engineering Data 39, 599–601.
-
- Badger MR. 1980. Kinetic properties of ribulose 1,5-bisphosphate carboxylase/oxygenase from Anabaena variabilis. Archives of Biochemistry and Biophysics 201, 247–254. - PubMed
-
- Badger MR, Andrews TJ. 1987. Co-evolution of Rubisco and CO2 concentrating mechanisms. In: Biggens J, ed. Progress in Photosynthesis Research, Vol. III Dordrecht: Martinus Nijhoff Publishers, 601–609.
-
- Badger MR, Collatz GJ. 1977. Studies on the kinetic mechanism of ribulose-1,5-bisphosphate carboxylase and oxygenase reactions, with particular reference to the effect of temperature on kinetic parameters. Carnegie Institution of Washington Yearbook 76, 355–361.
Publication types
MeSH terms
Substances
LinkOut - more resources
Full Text Sources
Other Literature Sources
Research Materials
Miscellaneous
