. 2017 Jan;31(1):1-10.
doi: 10.1038/leu.2016.160. Epub 2016 Jun 8.

Ordering of mutations in acute myeloid leukemia with partial tandem duplication of MLL (MLL-PTD)

Affiliations

Ordering of mutations in acute myeloid leukemia with partial tandem duplication of MLL (MLL-PTD)

Q-Y Sun et al. Leukemia. 2017 Jan.

Abstract

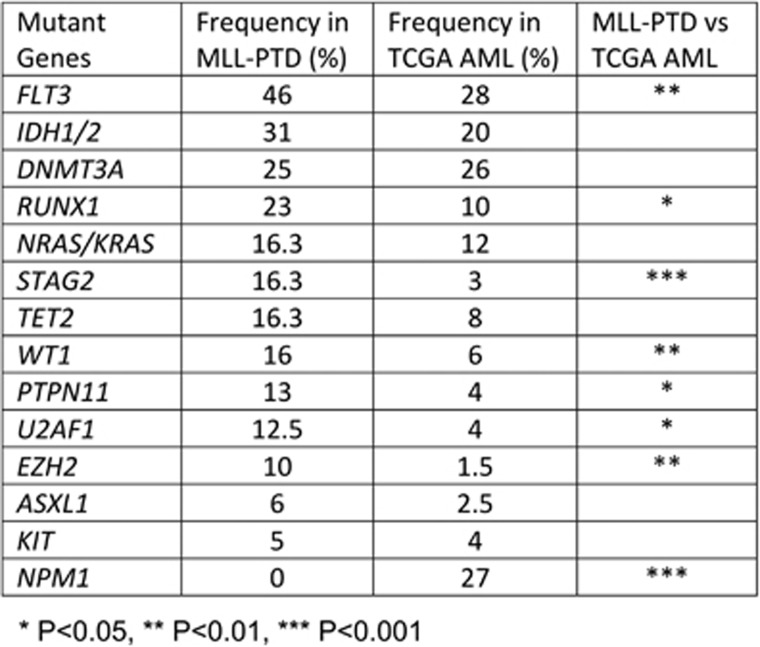
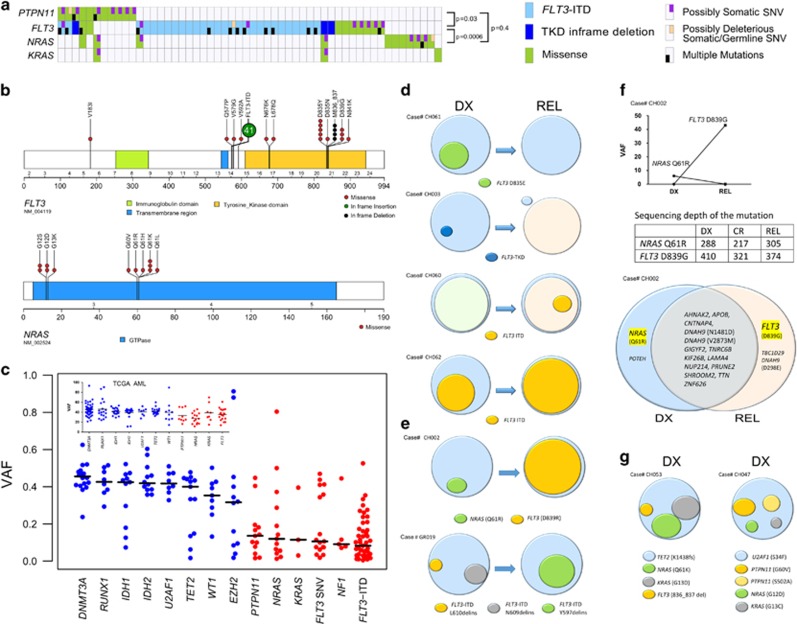
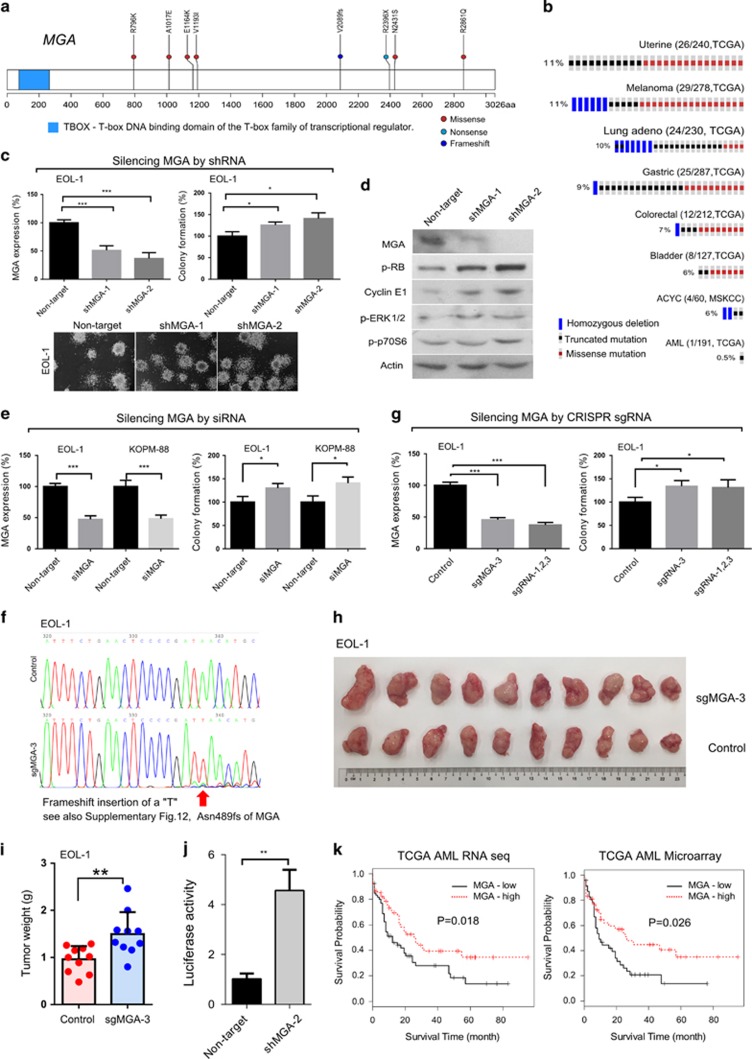
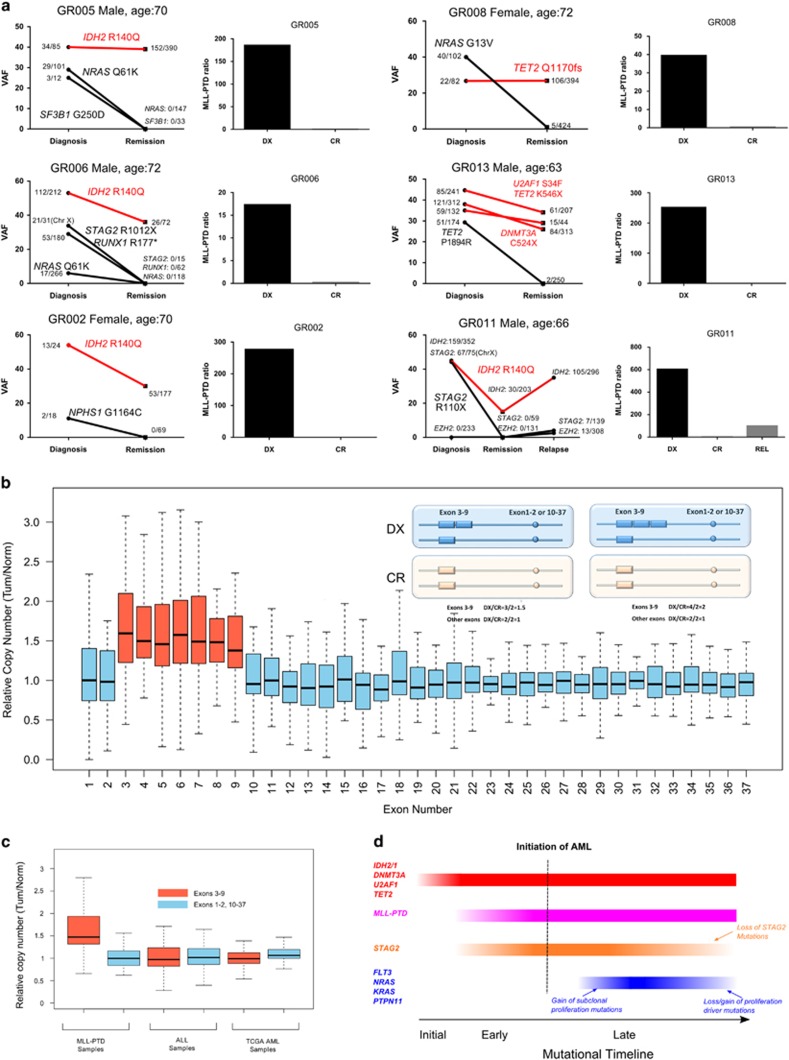
Partial tandem duplication of MLL (MLL-PTD) characterizes acute myeloid leukemia (AML) patients often with a poor prognosis. To understand the order of occurrence of MLL-PTD in relation to other major AML mutations and to identify novel mutations that may be present in this unique AML molecular subtype, exome and targeted sequencing was performed on 85 MLL-PTD AML samples using HiSeq-2000. Genes involved in the cohesin complex (STAG2), a splicing factor (U2AF1) and a poorly studied gene, MGA were recurrently mutated, whereas NPM1, one of the most frequently mutated AML gene, was not mutated in MLL-PTD patients. Interestingly, clonality analysis suggests that IDH2/1, DNMT3A, U2AF1 and TET2 mutations are clonal and occur early, and MLL-PTD likely arises after these initial mutations. Conversely, proliferative mutations (FLT3, RAS), typically appear later, are largely subclonal and tend to be unstable. This study provides important insights for understanding the relative importance of different mutations for defining a targeted therapeutic strategy for MLL-PTD AML patients.


Conflict of interest statement

Torsten Haferlach is employed by and partly owns the MLL Munich Leukemia Laboratory. Tamara Alpermann and Manja Meggendorfer are employed by the MLL Munich Leukemia Laboratory. The remaining authors declare no competing financial interests.

Figures

Figure 1
Figure 1
Mutational landscape of 80 MLL-PTD patients. Types of alterations are color-coded (lower right side of the figure). FLT3-ITD: FLT3 internal tandem duplication. TKD: FLT3 tyrosine kinase domain mutations. For patients with diagnosis and relapse samples, only the diagnosis mutations are shown (mutations of complete diagnosis-relapse trio patients are shown in Supplementary Figure 4). Only canonical hotspots or fs/stop-gain mutations found in both diagnosis and remission were considered as ‘mutation also present at remission'.
Figure 2
Figure 2
Differing rates of mutation in AML: our MLL-PTD cohort versus AMLs from TCGA. Comparison of the mutation rate of our 80 MLL-PTD AMLs and 200 AMLs from TCGA (includes nine MLL-PTD samples). Mutated NPM1 gene was found only in TCGA AMLs.
Figure 3
Figure 3
Mutations in the RAS-FLT3 pathway are subclonal and tend to be unstable. (a) Mutational landscape of patients carrying PTPN11, FLT3, NRAS and KRAS mutations. (b) Mutational diagram of FLT3 and NRAS in 80 MLL-PTD patients at diagnosis. In total, 41 FLT3-ITD mutations were detected in 27 patients. (c) Variant allele frequency (VAF) plot of the frequently mutated genes. Mutations in epigenetic regulator genes (blue) tend to have high VAF, whereas proliferation-related genes (red) tend to have low VAF, indicating that SNV mutations in proliferation-related genes are generally subclonal and occur later than the genes involved in epigenetic regulation. FLT3 SNV (single nucleotide variant) and FLT3-ITD are labeled separately. TCGA-AML result are shown as an insert. (d) FLT3 mutations are unstable during disease progression. Schematic diagrams demonstrating the proportion and progression of the FLT3 mutation carrying subclones inferred from their VAF in several diagnosis (DX) and relapse (REL) pairs are shown. Sequencing read depth of each mutation position are displayed in Supplementary Figure 9. (e) Mutations driving cell proliferation are replaceable during diagnosis and relapse. Upper pair, in patient CH002, mutant NRAS carrying subclone was found at leukemic diagnosis, this subclone subsequently was eliminated by chemotherapy. However, the founding clone survived during the chemotherapy, gained a FLT3 D839G mutation, and this alternative FLT3 carrying subclone (FLT3 D839G) expanded and became the dominant clone at relapse. Lower pair, in patient GR019, leukemia at diagnosis harbored two different FLT3-ITD carrying subclones, both were eliminated by chemotherapy. The founding clone survived the chemotherapy, and an alternative subclone derived from the founding clone harbored a different FLT3-ITD mutation, which subsequently appeared at relapse. (f) Diagram depicting VAF and sequencing read depth of NRAS and FLT3 mutations in patient CH002. Venn diagram indicates mutations that are either shared or distinct between the DX and REL samples. (g) Two case examples indicating the presence of multiple subclones carrying different proliferative driver mutations in patients' AML cells.
Figure 4
Figure 4
Members of the cohesin pathway are highly mutated in MLL-PTD AML. (a) Mutational diagram of the cohesin pathway genes in MLL-PTD patients. (b) Representative Sanger sequencing tracing showing the STAG2 (X-chromosome gene) mutation in patients GR011, CH044 and CH005. A complete C>T alteration was noted in patients GR011 and CH044 (both males), whereas heterozygous double peaks were noted in patient CH005 (female). (c) Clones carrying STAG2 mutation were present as dominant clone at diagnosis, but either disappeared or shrank drastically at relapse. GR011 at relapse had 7 of 146 STAG2 mutant reads detected by NGS sequencing (below the detection threshold of Sanger sequencing, see Figure 6a and Supplementary Figure 13 where the number of mutant reads of STAG2 in patients GR011 and CH060 are indicated). (d) Average VAF of STAG2 mutations in diagnosis samples corrected for gender of patients (X-chromosome gene). (e) Mutational heatmap of cohesin pathway genes in TCGA-AML. Two patients had both MLL-PTD and cohesin mutations (highlighted with a yellow triangle). One of the TCGA patients harbored a mutation of STAG2 in the same splicing site found in this study (highlighted with blue circle). (f) Mutual exclusivity of mutations of genes in the cohesin pathway within our MLL-PTD AML cohort. (g) STAG2 mutations are mutually exclusive with the splicing factor U2AF1 mutations as noted in our MLL-PTD AML cohort. Upper panel, mutational diagram of splicing factor U2AF1. Lower panel, mutually exclusive pattern between the samples carrying either STAG2 or U2AF1 mutations.
Figure 5
Figure 5
MGA is a potential tumor-suppressor mutated in MLL-PTD AML. (a) Diagram showing the mutational type and position within the MGA gene identified in MLL-PTD samples. Missense mutations R796K and V1193I of MGA occurred in the same sample. (b) High proportion of inactivating mutations were observed in MGA in a variety of cancers. Adeno, adenocarcinoma; ACYC, adenoid cystic carcinoma. (c) Enhanced colony formation in EOL-1 cells after silencing MGA with either shMGA-1 or shMGA-2. Left panel, real-time PCR result shows the silencing effect of MGA by two shRNAs; right panel, colony formation result of EOL-1 cell after silencing MGA with two shRNA. Mean±s.d., n=3, *P<0.05; ***P<0.001. Lower panel, representative photographs of EOL-1 colonies formed in methylcellulose of non-target shRNA (left photos) and shRNA silenced MGA (middle and right photos). (d) Silencing of MGA in EOL-1 cells increased protein levels of Cyclin E1 and phos-RB (S807, phosphorylation inhibits RB target binding and allow cell cycle progression). A representative western blot of four independent experiments is shown. (e) Enhanced colony formation in EOL-1 and KOPM88 cells after silencing MGA with siRNA pool (SMARTpool: ON-TARGETplus MGA siRNA, Dharmacon). SiRNA was delivered using Nucleofector™ electroporation device (Lonza). Transfection efficiency was >80% in both cell lines as determined by the co-transfected GFP. Left panel, real-time PCR result showing the silencing effect of MGA by siRNA pool in EOL-1 and KOPM88 cells; right panel, colony formation result of EOL-1 and KOPM88 cells after silencing MGA with siRNA pool. Mean±s.d., n=3. *P<0.05; ***P<0.001. (f) Sanger sequencing tracings depicting the frameshift insertion of a T nucleotide induced by CRISPR sgMGA-3 in EOL-1 cell line (see Supplementary Figures12c and d for detailed sequencing tracing and BLAST result). (g) Enhanced colony formation in EOL-1 after silencing MGA with CRISPR-sgRNA. Left panel, real-time PCR result indicating the silencing effect of MGA by a single CRISPR guide RNA (sgMGA-3) or a mixture of three sgRNAs targeting MGA (sgMGA-1,2,3); right panel, the colony-formation result of EOL-1 cell after silencing MGA with sgMGA-3 or a mixture of three sgRNAs designed to target MGA (sgMGA-1,2,3). Real-time PCR and colony-formation assay were performed 15 days after the lentiviral infection (3 days for virus infection, 7 days for puromycin selection and 5 days with normal medium). Mean±s.d., n=3. *P<0.05; ***P<0.001. (h and i) Enhanced tumor mass of MGA knockout EOL-1 cell in an in vivo xenograft model. Control EOL-1 cells or EOL-1 cells silenced with MGA CRISPR sgRNAs were injected into both flanks of NSG mice, and tumor masses were harvested 21 days after injection. (h) Photo of tumor masses dissected from the NSG mice, which were injected with EOL-1 cells after silencing MGA expression by CRISPR sgMGA-3 (upper panel) or control EOL-1 cells (lower panel); (i) Barplots indicating the weight of the tumor mass. Mean±s.d., n=10, **P<0.01. (j) Increased MYC activity in 293FT cells after stable silencing of MGA by shRNA. Luciferase activities were measured 48 h after transfection of cells with MYC activity reporter pMyc4ElbLuc (Addgene, #53246) and normalized to the corresponding co-transfected Renilla luciferase activity. Mean±s.d., n=3, **P<0.01. (k) Kaplan–Meier plot of overall survival: comparison of cases with highest versus lowest expression of MGA in AML patients. P-values were calculated by log-rank test. MGA expression data and patient survival data were retrieved from TCGA-AML patients RNA seq (left panel), or microarray (70 AML patients) (right panel). The MGA expression ‘high' and ‘low' groups were defined by 15% higher than the median or 15% lower than the median, respectively.
Figure 6
Figure 6
MLL-PTD is a clonal mutation that occurs before mutations of the RAS-RTK pathway, but later than the IDH2/DNMT3A/U2AF1/TET2 mutations. (a) AML mutations of either IDH2, TET2, DNMT3A, U2AF1 (colored in red) persist in the remission samples of eight patients with matched remission control (plot of two patients are shown in Supplementary Figure 13). Sequencing read depth of each mutation at different time point is indicated (mutant reads/total read of the indicated position). MLL-PTD level at each time point was determined by quantitative RT-PCR to calculate the MLL-PTD ratio (normalized copy number of MLL-PTD to ABL1 ratio ((MLL-PTD/ABL) × 100) according to the method described in Weisser et al.). (b) Diagram illustrating the relative copy number of each exon of the MLL gene. Inner picture depicts the expected relative copy number between DX and CR samples for exons affected by MLL-PTD (exons 3–9), and those unaffected by the aberration (other exons). Gain of exons 3–9 of the MLL gene could be observed in 28 MLL-PTD patients with matched remission control. (c) Diagram illustrating the relative copy number of exons 3–9 or exons 1–2, 10–37 of the MLL gene in 28 pair MLL-PTD patients, 200 pediatric ALL patients (Supplementary Figure 15b) and 120 TCGA-AML patients (the 9 MLL-PTD samples were excluded). (d) Mutational timeline model for the sequence of acquisition of IDH2/DNMT3A/U2AF1/TET2, MLL-PTD and the FLT3/NRAS/KRAS/PTPN11 mutations in MLL-PTD AML patients.

Similar articles

Cited by

References

    1. Ley TJ, Mardis ER, Ding L, Fulton B, McLellan MD, Chen K et al. DNA sequencing of a cytogenetically normal acute myeloid leukaemia genome. Nature 2008; 456: 66–72. - PMC - PubMed
    1. Estey E, Döhner H. Acute myeloid leukaemia. Lancet 2006; 368: 1894–1907. - PubMed
    1. Patel JP, Gonen M, Figueroa ME, Fernandez H, Sun Z, Racevskis J et al. Prognostic relevance of integrated genetic profiling in acute myeloid leukemia. N Engl J Med 2012; 366: 1079–1089. - PMC - PubMed
    1. Kihara R, Nagata Y, Kiyoi H, Kato T, Yamamoto E, Suzuki K et al. Comprehensive analysis of genetic alterations and their prognostic impacts in adult acute myeloid leukemia patients. Leukemia 2014; 28: 1586–1595. - PubMed
    1. Dohner K, Tobis K, Ulrich R, Frohling S, Benner A, Schlenk RF et al. Prognostic significance of partial tandem duplications of the MLL gene in adult patients 16 to 60 years old with acute myeloid leukemia and normal cytogenetics: a study of the Acute Myeloid Leukemia Study Group Ulm. J Clin Oncol 2002; 20: 3254–3261. - PubMed