Altered Development of Synapse Structure and Function in Striatum Caused by Parkinson's Disease-Linked LRRK2-G2019S Mutation
- PMID: 27383589
- PMCID: PMC4938860
- DOI: 10.1523/JNEUROSCI.3314-15.2016
Altered Development of Synapse Structure and Function in Striatum Caused by Parkinson's Disease-Linked LRRK2-G2019S Mutation
Abstract
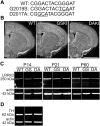
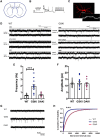
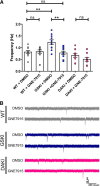
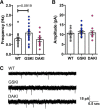
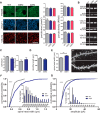
Mutations in the gene encoding leucine-rich repeat kinase 2 (LRRK2) can cause Parkinson's disease (PD), and the most common disease-associated mutation, G2019S, increases kinase activity. Because LRRK2 expression levels rise during synaptogenesis and are highest in dorsal striatal spiny projection neurons (SPNs), we tested the hypothesis that the LRRK2-G2019S mutation would alter development of excitatory synaptic networks in dorsal striatum. To circumvent experimental confounds associated with LRRK2 overexpression, we used mice expressing LRRK2-G2019S or D2017A (kinase-dead) knockin mutations. In whole-cell recordings, G2019S SPNs exhibited a fourfold increase in sEPSC frequency compared with wild-type SPNs in postnatal day 21 mice. Such heightened neural activity was increased similarly in direct- and indirect-pathway SPNs, and action potential-dependent activity was particularly elevated. Excitatory synaptic activity in D2017A SPNs was similar to wild type, indicating a selective effect of G2019S. Acute exposure to LRRK2 kinase inhibitors normalized activity, supporting that excessive neural activity in G2019S SPNs is mediated directly and is kinase dependent. Although dendritic arborization and densities of excitatory presynaptic terminals and postsynaptic dendritic spines in G2019S SPNs were similar to wild type, G2019S SPNs displayed larger spines that were matched functionally by a shift toward larger postsynaptic response amplitudes. Acutely isolating striatum from overlying neocortex normalized sEPSC frequency in G2019S mutants, supporting that abnormal corticostriatal activity is involved. These findings indicate that the G2019S mutation imparts a gain-of-abnormal function to SPN activity and morphology during a stage of development when activity can permanently modify circuit structure and function.
Significance statement: Mutations in the kinase domain of leucine-rich repeat kinase 2 (LRRK2) follow Parkinson's disease (PD) heritability. How such mutations affect brain function is poorly understood. LRRK2 expression levels rise after birth at a time when synapses are forming and are highest in dorsal striatum, suggesting that LRRK2 regulates development of striatal circuits. During a period of postnatal development when activity plays a large role in permanently shaping neural circuits, our data show how the most common PD-causing LRRK2 mutation dramatically alters excitatory synaptic activity and the shape of postsynaptic structures in striatum. These findings provide new insight into early functional and structural aberrations in striatal connectivity that may predispose striatal circuitry to both motor and nonmotor dysfunction later in life.
Keywords: G2019S; LRRK2; activity; dorsal striatum; spine morphology; synapse.
Copyright © 2016 the authors 0270-6474/16/367129-14$15.00/0.
Figures

Similar articles
-
Pathway-specific dysregulation of striatal excitatory synapses by LRRK2 mutations.Elife. 2020 Oct 2;9:e58997. doi: 10.7554/eLife.58997. Elife. 2020. PMID: 33006315 Free PMC article.
-
Parkinson's Disease-Linked LRRK2-G2019S Mutation Alters Synaptic Plasticity and Promotes Resilience to Chronic Social Stress in Young Adulthood.J Neurosci. 2018 Nov 7;38(45):9700-9711. doi: 10.1523/JNEUROSCI.1457-18.2018. Epub 2018 Sep 24. J Neurosci. 2018. PMID: 30249796 Free PMC article.
-
Dopamine D2 receptor activation potently inhibits striatal glutamatergic transmission in a G2019S LRRK2 genetic model of Parkinson's disease.Neurobiol Dis. 2018 Oct;118:1-8. doi: 10.1016/j.nbd.2018.06.008. Epub 2018 Jun 13. Neurobiol Dis. 2018. PMID: 29908325
-
Functional and behavioral consequences of Parkinson's disease-associated LRRK2-G2019S mutation.Biochem Soc Trans. 2018 Dec 17;46(6):1697-1705. doi: 10.1042/BST20180468. Epub 2018 Dec 4. Biochem Soc Trans. 2018. PMID: 30514770 Free PMC article. Review.
-
In Vitro Modeling of Leucine-Rich Repeat Kinase 2 G2019S-Mediated Parkinson's Disease Pathology.Stem Cells Dev. 2018 Jul 15;27(14):960-967. doi: 10.1089/scd.2017.0286. Epub 2018 Mar 29. Stem Cells Dev. 2018. PMID: 29402177 Free PMC article. Review.
Cited by
-
Computational modeling of tau pathology spread reveals patterns of regional vulnerability and the impact of a genetic risk factor.Sci Adv. 2021 Jun 9;7(24):eabg6677. doi: 10.1126/sciadv.abg6677. Print 2021 Jun. Sci Adv. 2021. PMID: 34108219 Free PMC article.
-
Neuronal vulnerability in Parkinson disease: Should the focus be on axons and synaptic terminals?Mov Disord. 2019 Oct;34(10):1406-1422. doi: 10.1002/mds.27823. Epub 2019 Sep 4. Mov Disord. 2019. PMID: 31483900 Free PMC article. Review.
-
Inhibition of LRRK2 kinase activity promotes anterograde axonal transport and presynaptic targeting of α-synuclein.Acta Neuropathol Commun. 2021 Nov 8;9(1):180. doi: 10.1186/s40478-021-01283-7. Acta Neuropathol Commun. 2021. PMID: 34749824 Free PMC article.
-
Midbrain organoids mimic early embryonic neurodevelopment and recapitulate LRRK2-p.Gly2019Ser-associated gene expression.Am J Hum Genet. 2022 Feb 3;109(2):311-327. doi: 10.1016/j.ajhg.2021.12.009. Epub 2022 Jan 24. Am J Hum Genet. 2022. PMID: 35077669 Free PMC article.
-
Improvements of Motor Performances in the Drosophila LRRK2 Loss-of-Function Model of Parkinson's Disease: Effects of Dialyzed Leucocyte Extracts from Human Serum.Brain Sci. 2020 Jan 14;10(1):45. doi: 10.3390/brainsci10010045. Brain Sci. 2020. PMID: 31947539 Free PMC article.
References
-
- Arranz AM, Delbroek L, Van Kolen K, Guimarães MR, Mandemakers W, Daneels G, Matta S, Calafate S, Shaban H, Baatsen P, De Bock PJ, Gevaert K, Vanden Berghe P, Verstreken P, De Strooper B, Moechars D. LRRK2 functions in synaptic vesicle endocytosis through a kinase-dependent mechanism. J Cell Sci. 2015;128:541–552. doi: 10.1242/jcs.158196. - DOI - PubMed
Publication types
MeSH terms
Substances
Grants and funding
LinkOut - more resources
Full Text Sources
Other Literature Sources
Medical
Molecular Biology Databases
