. 2016 Jul 26;7(30):48231-48249.
doi: 10.18632/oncotarget.10197.

The activation of OR51E1 causes growth suppression of human prostate cancer cells

Affiliations

The activation of OR51E1 causes growth suppression of human prostate cancer cells

Désirée Maßberg et al. Oncotarget. .

Abstract

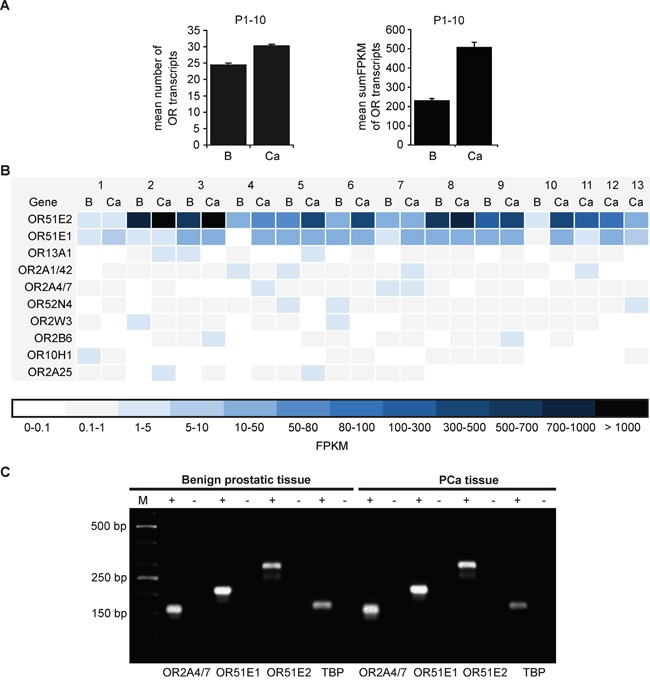
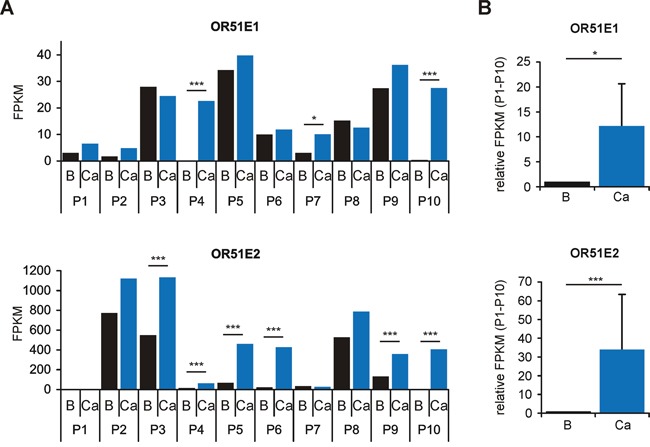
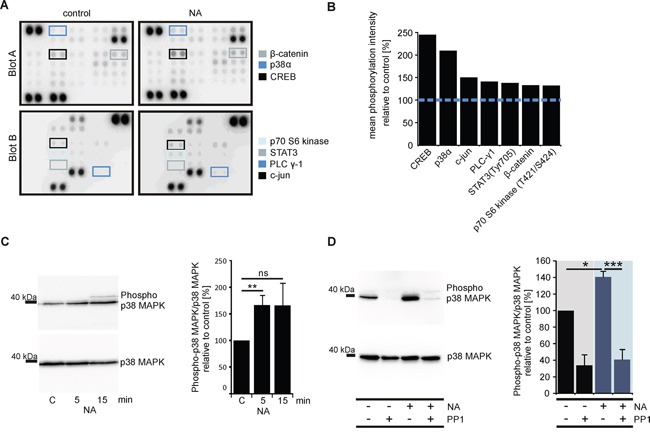
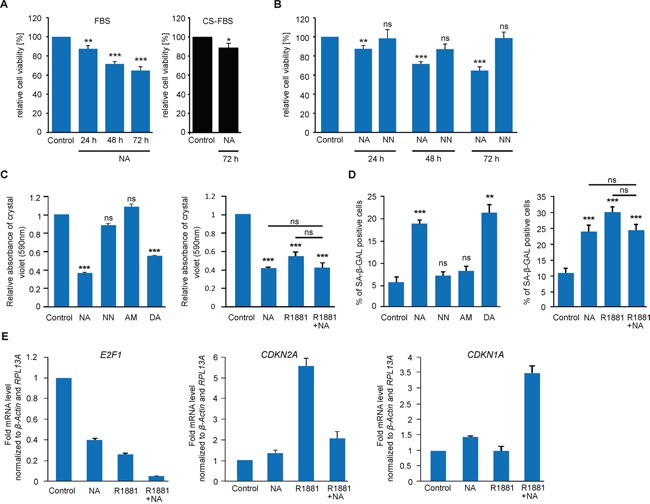
The development of prostate cancer (PCa) is regulated by the androgen-dependent activity of the androgen receptor (AR). Androgen-deprivation therapy (ADT) is therefore the gold standard treatment to suppress malignant progression of PCa. Nevertheless, due to the development of castration resistance, recurrence of disease after initial response to ADT is a major obstacle to successful treatment. As G-protein coupled receptors play a fundamental role in PCa physiology, they might represent promising alternative or combinatorial targets for advanced diseases. Here, we verified gene expression of the olfactory receptors (ORs) OR51E1 [prostate-specific G-protein coupled receptor 2 (PSGR2)] and OR51E2 (PSGR) in human PCa tissue by RNA-Seq analysis and RT-PCR and elucidated the subcellular localization of both receptor proteins in human prostate tissue. The OR51E1 agonist nonanoic acid (NA) leads to the phosphorylation of various protein kinases and growth suppression of the PCa cell line LNCaP. Furthermore, treatment with NA causes reduction of androgen-mediated AR target gene expression. Interestingly, NA induces cellular senescence, which coincides with reduced E2F1 mRNA levels. In contrast, treatment with the structurally related compound 1-nonanol or the OR2AG1 agonist amyl butyrate, neither of which activates OR51E1, did not lead to reduced cell growth or an induction of cellular senescence. However, decanoic acid, another OR51E1 agonist, also induces cellular senescence. Thus, our results suggest the involvement of OR51E1 in growth processes of PCa cells and its impact on AR-mediated signaling. These findings provide novel evidences to support the functional importance of ORs in PCa pathogenesis.

Keywords: OR51E1; androgen receptor; cellular senescence; proliferation; prostate cancer.


Conflict of interest statement

The authors declare that there is no conflicts of interest.

Figures

Figure 1
Figure 1. Expression profile of ORs in benign prostatic and PCa tissue as determined by RNA-Seq
A. (Left) Shown is the average number of expressed ORs with an FPKM >0.1 of all annotated OR genes (n = 387) in human benign prostatic (B) and PCa (Ca) tissues (P1-P10). (Right) Summed FPKM values of all expressed OR genes in human benign prostatic (B) and PCa (Ca) tissues (P1-P10). The FPKM values of the benign prostatic and PCa samples (P1-P10) were averaged. Error bars represent the standard deviation. B. The heat map illustrates the ten most highly expressed OR transcripts in human benign prostatic (B) and PCa (Ca) tissues (P1-P13). The RNA-Seq data sets were obtained from ten different patients (P1-P10). In addition three self-generated data sets of prostate PCa tissue were analyzed (P11-P13). Genes in the heat maps are sorted by the sum of all investigated tissues. Black and dark blue represent high transcript expression, and light blue and white indicate low to no detectable transcript expression. C. RT-PCR for the verification of OR2A4/7, OR51E1 and OR51E2 in benign prostatic and PCa tissue. The housekeeping gene TATA box binding protein (TBP) was used for quality control of the cDNA. The RNA samples converted into cDNA are shown as (+), and the negative controls containing RNA are shown as (−). M: marker; bp: base pairs.
Figure 2
Figure 2. Differential expression analysis of OR51E1 and OR51E2 in human prostate tissue as determined by RNA-Seq
A. Differential expression analysis of the receptors OR51E1 (top) and OR51E2 (bottom) in benign prostatic (B, black bars) and PCa tissues (Ca, blue bars) from ten different patients (P1-P10). Statistical significances of matched tissue pairs were analyzed using Cuffdiff. B. The bar diagram demonstrates significantly increased expression of the receptors OR51E1 and OR51E2 in PCa tissue (P1-P10, Mann-Whitney Rank Sum Test). Each FPKM value for OR51E1 (top) and OR51E2 (below) of benign prostatic (B, black bars) samples (P1-P10) was normalized to the FPKM value of the corresponding PCa samples (Ca, blue bars). Error bars represent the mean ± SEM. * p < 0.05, *** p < 0.001.
Figure 3
Figure 3. Protein expression of OR51E1 and OR51E2 in human prostate tissue
A. IHC of prostate tissues using specific human α-OR51E1- and α-OR51E2 antibodies. Shown is the expression of both receptor proteins in prostate epithelial cells of moderately differentiated and well differentiated PCa. The expression of OR51E1 is primarily localized in the apical cytoplasm (black arrow) but is also observed in basal epithelial structures (red arrow) or diffusely in cytoplasm, similar to OR51E2. Protein expression is visualized using DAB chromogenic staining. Tissue architecture is illustrated by co-staining with HE. Scale bar: 100 μm, enlarged: 25 μm. B. IHC of a large PCa progression cohort including benign tissue, primary tumors, lymph node metastases as well as distant metastases/CRPC tissues using α-OR51E1 antibody. Upper table shows the expression score of OR51E1 protein in the different prostate tissues indicated as no, low or high expression level. Protein expression is visualized using DAB chromogenic staining and tissue architecture was stained by HE and bluing reagent. Scale bar: 50 μm.
Figure 4
Figure 4. Expression of ORs in the PCa cell line LNCaP
A. RT-PCR detection of OR51E1, OR51E2 and OR2A4/7 in LNCaP cells. In addition, the prostate specific markers PSA, AR, KRT8 and KRT18 were examined. The housekeeping gene GAPDH was used for quality control of cDNA. The cDNA samples are represented as (+), and the negative controls containing RNA are represented as (−). M: marker; bp: base pairs. B. IF detected protein expression of the receptors OR51E1 (top, red) and OR2A4/7 (bottom, red) in LNCaP cells visualized by confocal immunofluorescence microscopy. Nuclei were stained with DAPI (blue). Scale: 20 μm.
Figure 5
Figure 5. OR51E1 agonist NA induces phosphorylation of protein kinases in LNCaP cells
A. Nitrocellulose membranes A and B of the Human Phospho-Kinase Array plotted with proteins from the LNCaP cells stimulated with NA (300 μM, right) or control (left). The specific antibodies against phosphorylated protein kinases are spotted in duplicate. The colored boxes marked areas where differences in the protein signal intensities between NA-treated and control-treated cells were detected. B. Quantification of the pixel intensities of the phosphorylated protein kinases. The pixel intensities of duplicates were averaged, and the NA-stimulated LNCaP cells were presented relative to the control (blue dashed line, n=1). C. Western blot analysis to investigate the phosphorylation levels of p38 MAPK in LNCaP cells after 5 min or 15 min stimulations with NA (300 μM) or control. Determination of the total amounts of p38 MAPK served as controls (left). Quantification of the mean pixel intensities of phosphorylated p38 MAPK relative to p38 MAPK (right). Ratios were normalized against control-treated cells (C) D. Western blot analysis to investigate the phosphorylation levels of p38 MAPK in LNCaP cells after 5 min stimulation with NA (300 μM), control, NA along with the Src kinase inhibitor PP1 analog (PP1, 10 μM) and PP1alone (left). The cells were pre-incubated for 30 min with the PP1 analog (10 μM). The total levels of p38 MAPK served as controls. Quantification of the mean pixel intensities of phosphorylated p38 MAPK relative to p38 MAPK (right). Ratios were normalized against control-treated cells. Unless stated otherwise, each Western Blot was repeated in at least three independent experiments. Error bars represent the mean ± SEM. * p < 0.05, ** p < 0.01, *** p < 0.001.
Figure 6
Figure 6. NA reduces the proliferation of LNCaP cells and promotes cellular senescence via the transcriptional regulation of tumor suppressor proteins
A. MTT proliferation assay of LNCaP cells treated with NA (300 μM) or control for 24 h, 48 h and 72 h in FBS-containing growth medium (10%, blue; n=8) or for 72 h in charcoal-stripped FBS (CS-FBS)-containing medium (10%, black; n=8). All values were normalized to the control, respectively. B. MTT proliferation assay of LNCaP cells treated with (left) 300 μM NA, NN, or control for 24 h, 48 h and 72 h to assess the specificity of NA. C. Relative density of LNCaP cells measured by crystal violet absorbance after 72 h of treatment with (left) control, 300 μM NA, NN, AM, or DA and (right) control, 300 μM NA, 1 nM R1881, or with the combination of R1881 and NA in growth medium containing 5% FBS (n=6). D. Determination of cellular senescence in LNCaP cells after 72 h of treatment with (left) control, 300 μM NA, NN, AM, or DA and (right) control, 300 μM NA, 1 nM R1881, or the combination of R1881 and NA in growth medium containing 5% FBS. LNCaP cells were detected for SA β-Gal activity. Unless stated otherwise, each experimental set contained triplicates and was repeated in at least three independent experiments. Error bars represent the mean ± SEM. * p < 0.05, ** p < 0.01, *** p < 0.001, ns=not significant. E. qRT-PCR to estimate relative mRNA expression levels of E2F1 (left), CDKN2A (p16, middle), and CDKN1A (p21, right). LNCaP cells were treated with NA (300 μM), R1881 (1 nM), the combination of both or control. The Ct-values of β-actin and RPL13A were used for normalization.
Figure 7
Figure 7. NA affects AR signaling in LNCaP cells
A. ICC of the AR in LNCaP cells treated with NA (300 μM) or control in the presence of DHT (10 nM). Protein expression is visualized using DAB chromogenic staining. Scale bar: 200 μm (10x); enlarged: 50 μm (40x). B. Activation of OR51E1 influences AR-target gene expression. qRT-PCR experiments to estimate relative mRNA expression levels of (left) PSA (KLK3) and (right) the homeobox protein NKX3-1. LNCaP cells were treated with NA (300 μM), R1881 (1 nM), the combination of both or control. The Ct-values of β-actin and RPL13A were used for normalization. C. Determination of the PSA levels secreted by LNCaP cells. Cells were treated for 48 h with NA (300 μM) in presence of DHT (10 nM, blue), R1881 (1 nM, gray) or in androgen-free medium (black). PSA levels were presented relative to the same conditions without NA, respectively, as indicated as gray dashed line. Each experimental set contained duplicates and was repeated in three independent experiments. D. MTT proliferation assay of LNCaP cells treated with 300 μM NA, flutamide (Flu 10 μM), control or the co-treatment of NA and flutamide (NA + Flu) for 24 h, 48 h and 72 h in 10% FBS-containing medium. Unless stated otherwise, each experimental set contained triplicates and was repeated in at least three independent experiments. Error bars represent the mean ± SEM. * p < 0.05, ** p < 0.01, *** p < 0.001, ns = not significant.

Similar articles

Cited by

References

    1. Siegel R, Naishadham D, Jemal A. Cancer statistics, 2013. CA Cancer J Clin. 2013;63:11–30. - PubMed
    1. Karantanos T, Corn PG, Thompson TC. Prostate cancer progression after androgen deprivation therapy: mechanisms of castrate resistance and novel therapeutic approaches. Oncogene. 2013;32:5501–5511. - PMC - PubMed
    1. Perner S, Cronauer MV, Schrader AJ, Klocker H, Culig Z, Baniahmad A. Adaptive responses of androgen receptor signaling in castration-resistant prostate cancer. Oncotarget. 2015;6:35542–35555. doi: 10.18632/oncotarget.4689. - DOI - PMC - PubMed
    1. Calabrese EJ. Androgens: biphasic dose responses. Crit Rev Toxicol. 2001;31:517–522. - PubMed
    1. Umekita Y, Hiipakka RA, Kokontis JM, Liao S. Human prostate tumor growth in athymic mice: inhibition by androgens and stimulation by finasteride. Proc Natl Acad Sci U S A. 1996;93:11802–11807. - PMC - PubMed

MeSH terms