. 2016 Oct;136(10):1990-2002.
doi: 10.1016/j.jid.2016.06.608. Epub 2016 Jun 29.

Therapeutic Elimination of the Type 1 Interferon Receptor for Treating Psoriatic Skin Inflammation

Affiliations

Therapeutic Elimination of the Type 1 Interferon Receptor for Treating Psoriatic Skin Inflammation

Jun Gui et al. J Invest Dermatol. 2016 Oct.

Abstract

Phototherapy with UV light is a standard treatment for psoriasis, yet the mechanisms underlying the therapeutic effects are not well understood. Studies in human and mouse keratinocytes and in the skin tissues from human patients and mice showed that UV treatment triggers ubiquitination and downregulation of the type I IFN receptor chain IFNAR1, leading to suppression of IFN signaling and an ensuing decrease in the expression of inflammatory cytokines and chemokines. The severity of imiquimod-induced psoriasiform inflammation was greatly exacerbated in skin of mice deficient in IFNAR1 ubiquitination (Ifnar1(SA)). Furthermore, these mice did not benefit from UV phototherapy. Pharmacologic induction of IFNAR1 ubiquitination and degradation by an antiprotozoal agent halofuginone also relieved psoriasiform inflammation in wild-type but not in Ifnar1(SA) mice. These data identify downregulation of IFNAR1 by UV as a major mechanism of the UV therapeutic effects against the psoriatic inflammation and provide a proof of principle for future development of agents capable of inducing IFNAR1 ubiquitination and downregulation for the treatment of psoriasis.


Figures

Figure 1
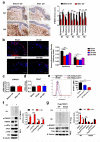
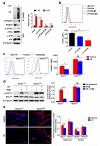
Figure 1. UV downregulates IFNAR1 in human and mouse keratinocytes and skin tissues
(a) Representative IFNAR1 IHC staining (left) of human normal skin before and 24 h after UV treatment (#3 and 4) and quantification of these data from all samples (right). Scale bar 100 μm. Data are shown as the means ± SEM (n=5). *, P <0.05; **, P < 0.01. (b) immunofluorescent analysis (left) and its quantification (right) of normal skin sections from non-irradiated (sham), and UV-irradiated WT mice 6, 24, and 48 h after treatment stained with DAPI (blue) and anti-IFNAR1 (red). Scale bar 100 μm. Data are shown as the means ± SEM (n=6).*, P <0.05; ***, P <0.001. (c) The relative IFNAR1 mRNA level in human normal skin before and 24 h after UV treatment. Data are shown the means± SEM (n=5). (d) The relative Ifnar1 mRNA level in the skin from non-irradiated (sham), and UV-irradiated WT mice 6 and 24 h after treatment. Data are shown as the means ± SEM (n=6). (e) Representative FACS analysis of the cell surface IFNAR1 level (left) and the quantified MFI of IFNAR1 (normalize to IgG-Ctrl staining cells, right) in non-irradiated (sham) and UV-irradiated HaCaT cells 3 h after treatment. Data are shown the means± SEM (n=3). *, P <0.05; **, P < 0.01. (f) Representative Immunoblotting of immunoprecipitated IFNAR1 and whole cell lysates (WCL) (left) and the quantification of the ratio of indicated band intensity (right) from non-irradiated and UV-irradiated HaCaT cells 1 h after treatment. Data are shown the means± SEM (n=3). ***, P <0.001. (g) Representative Immunoblotting of immunoprecipitated IFNAR1 and whole cell lysates (WCL) (left) and the quantification of the ratio of indicated band intensity (right) from HaCaT cells transiently expressed Flag-IFNAR1 (wild type or S532A mutant) 1 h after UV treatment or without irradiation. Data are shown the means± SEM (n=3). **, P < 0.01; ***, P <0.001.
Figure 2
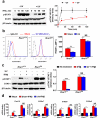
Figure 2. UV inhibits IFN signaling
(a) Representative immunoblotting analysis of STAT1 phosphorylation (left) and the quantification (the ratio of band intensity of phospho-STAT1 to total STAT1, right) in non-irradiated and UV-irradiated HaCaT cells treated with IFNα (100 IU/mL) for the indicated time points. Data are shown the means± SEM (n=3). *, P <0.05. (b) Representative FACS analysis of the cell surface IFNAR1 level (left) and the quantified MFI of IFNAR1 (normalize to IgG-Ctrl staining cells, right) in non-irradiated (sham) and UV-irradiated primary keratinocytes isolated from neonatal WT (Ifnar1+/+) and Ifnar1SA mice 3 h after treatment. Data are shown the means± SEM (n=3). **, P < 0.01. (c) Representative immunoblotting analysis of STAT1 phosphorylation (left) and the quantification (the ratio of band intensity of phospho-STAT1 to total STAT1, right) in non-irradiated and UV-irradiated primary keratinocytes (Ifnar1+/+ and Ifnar1SA) treated with IFNβ (1000 IU/mL) for 15 min. Data are shown the means± SEM (n=3). ***, P < 0.001. (d) Relative (to mock treated cells, average value 1.0) mRNA expression levels of indicated genes in non-irradiated (sham) and UV-irradiated primary keratinocytes (Ifnar1+/+ and Ifnar1SA) treated with IFNβ (1000 IU/mL) for 6 h. Data are shown as the means ± SEM (n=3). *, P <0.05; **, P < 0.01.
Figure 3
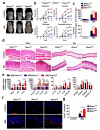
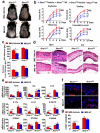
Figure 3. IFNAR1 levels determine the severity of psoriasiform skin inflammation
Ifnar1+/+, Ifnar1−/−, and Ifnar1SA mice were treated with IMQ cream for 5 consecutive days on the shaved back skin and ear. Skin and ear tissue samples were harvested on day 6. (a) Phenotypical presentation of WT (Ifnar1+/+), IFNAR1 deficient (Ifnar1−/−), and IFNAR1 SA (Ifnar1SA) mice on day 6 after IMQ treatment or no treatment (Control) of the shaved back skin. (b) Time course of the scores in WT (Ifnar1+/+), IFNAR1 deficient (Ifnar1−/−), and IFNAR1 SA mice (Ifnar1SA). Data show the means ± SEM (n=4-5). *, P <0.05; **, P < 0.01. ***, P<0.001. (c) The skin and ear thickness of WT (Ifnar1+/+), IFNAR1 deficient (Ifnar1−/−), and IFNAR1 SA mice (Ifnar1SA) after IMQ treatment or no treatment (Control). Data show the means ± SEM (n=4-5). *, P <0.05; **, P < 0.01. (d) H&E staining of skin and ear tissue from WT (Ifnar1+/+), IFNAR1 deficient (Ifnar1−/−), and IFNAR1 SA mice (Ifnar1SA) after IMQ treatment or no treatment (Control). Individual experiments were conducted 3 times with similar results, with 1 representative shown for each group. Scale bars (100 μm). (e) Relative fold increase (IMQ treated over untreated) of mRNA levels of indicated genes in the skin tissues of WT (Ifnar1+/+), IFNAR1 deficient (Ifnar1−/−), and IFNAR1 SA mice (Ifnar1SA) mice on day 6. Data are shown the means ± SEM (n=4-5). *, P <0.05; **, P < 0.01. ***, P<0.001. (f) Immunofluorescent analysis of skin sections stained with DAPI (blue) and anti-CD45 (red) on day 6. Individual experiments were conducted 3 times with similar results, with 1 representative shown for each group. Scale bars (100 μm). (g) Quantitative analysis of CD45-positive cells in each section shown in f. Data are shown the means ± SEM (n=5). *, P <0.05; ***, P<0.001.
Figure 4
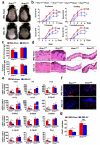
Figure 4. IFNAR1 downregulation is required for efficient UV therapy
Ifnar1+/+ and Ifnar1SA mice were treated with IMQ cream for 5 consecutive days on the shaved back skin and ear, and then irradiated or not (sham) with UV each day after IMQ treatment. Skin and ear tissue samples were harvested on day 6. (a) Phenotypical presentation at day 6 of non-irradiated (sham) IMQ-treated, and UV-irradiated IMQ-treated WT (Ifnar1+/+) and IFNAR1 SA (Ifnar1SA) mice. (b) Time course of the scores in non-irradiated (sham) IMQ-treated, and UV-irradiated IMQ-treated WT (Ifnar1+/+) and IFNAR1 SA mice (Ifnar1SA). Data show the means ± SEM (n=4-6). *, P <0.05. (c) The skin and ear thickness of non-irradiated (sham) IMQ-treated, and UV-irradiated IMQ-treated WT (Ifnar1+/+) and IFNAR1 SA mice (Ifnar1SA). Data show the means ± SEM (n=4-6). *, P <0.05. (d) H&E staining of skin and ear tissue from non-irradiated (sham) IMQ-treated, and UV-irradiated IMQ-treated WT (Ifnar1+/+) and IFNAR1 SA mice (Ifnar1SA). Individual experiments were conducted 3 times with similar results, with 1 representative shown for each group. Scale bars (100 μm). (e) Relative mRNA fold increase (over non-IMQ treated mice) at day 6 of indicated genes in the skin tissues of non-irradiated (sham) IMQ-treated, and UV-irradiated IMQ-treated WT (Ifnar1+/+) and IFNAR1 SA mice (Ifnar1SA). Data show the means ± SEM (n=4-6). *, P <0.05; **, P < 0.01. ***, P<0.001. (f) Immunofluorescent analysis of skin sections at day 6 stained with DAPI (blue) and anti-CD45 (red) from non-irradiated (sham) IMQ-treated, and UV-irradiated IMQ-treated WT (Ifnar1+/+) and IFNAR1 SA (Ifnar1SA) mice. Individual experiments were conducted 3 times with similar results, with 1 representative shown for each group. Scale bars (100 μm). (g) Quantitative analysis of CD45-positive cells in each section shown in f. Data are shown the means ± SEM (n=5).*, P <0.05.
Figure 5
Figure 5. The anti-protozoan drug halofuginone (HF) downregulates IFNAR1
(a) Representative immunoblotting analysis of immunoprecipitated IFNAR1 and whole cell lysates (WCL) (left) and the quantification of the ratio of indicated band intensity (right) from vehicle- and HF-treated HaCaT cells 3 h after treatment. Data are shown the means± SEM (n=3). *, P <0.05; **, P < 0.01. ***, P<0.001. (b) Representative FACS analysis of cell surface IFNAR1 level (above) and the quantified MFI of IFNAR1 (normalize to IgG-Ctrl staining cells, below) in vehicle- and HF-treated HaCaT cells 6 h after treatment. Data are shown the means± SEM (n=3). *, P <0.05; **, P < 0.01. (c) Representative FACS analysis of cell surface IFNAR1 level (left) and the quantified MFI of IFNAR1 (normalize to IgG-Ctrl staining cells, right) in vehicle- and HF-treated primary keratinocytes isolated from neonatal WT (Ifnar1+/+) and Ifnar1SA mice 6 h after treatment. Data are shown the means± SEM (n=3). *, P <0.05. (d) Representative immunoblotting analysis of STAT1 phosphorylation (left) and the quantification (the ratio of band intensity of phospho-STAT1 to total STAT1, right) in vehicle- and HF-treated primary keratinocytes (Ifnar1+/+ and Ifnar1SA) treated with IFNβ (1000 IU/mL) for 15 min. Data are shown the means± SEM (n=3). **, P < 0.01. (e) Ifnar1+/+ and Ifnar1SA mice were injected intraperitoneally with 10% DMSO (vehicle) or 250 μg/kg of HF. Immunofluorescent analysis of skin sections stained with DAPI (blue) and anti-IFNAR1 (red) 12 h after HF injection (left) and its quantification (right). Scale bar 100 μm. Data are shown the means± SEM (n=4).*, P <0.05; **, P < 0.01.
Figure 6
Figure 6. Downregulation of IFNAR1 by HF attenuates the severity of psoriatic inflammation
Ifnar1+/+ and Ifnar1SA mice were treated with IMQ cream for 5 consecutive days on the shaved back skin and ear, and injected intraperitoneally with 10% DMSO (vehicle) or 250 μg/kg of HF every other day, starting on the first day after IMQ treatment. Skin and ear tissue samples were harvested on day 6. (a) Phenotypical presentation at day 6 of IMQ- and vehicle-treated, and IMQ- and HF-treated WT (Ifnar1+/+) and IFNAR1 SA (Ifnar1SA) mice. (b) Time course of the scores in IMQ- and vehicle-treated, and IMQ- and HF-treated WT (Ifnar1+/+) and IFNAR1 SA mice (Ifnar1SA). Data show the means ± SEM (n=4-5). *, P <0.05. (c) The skin and ear thickness of IMQ- and vehicle-treated, and IMQ- and HF-treated WT (Ifnar1+/+) and IFNAR1 SA mice (Ifnar1SA). Data show the means ± SEM (n=4-5). **, P <0.01. (d) H&E staining of skin and ear tissue from IMQ- and vehicle-treated, and IMQ- and HF-treated WT (Ifnar1+/+) and IFNAR1 SA mice (Ifnar1SA). Individual experiments were conducted 3 times with similar results, with 1 representative shown for each group. Scale bars (100 μm). (e) Relative mRNA fold increase (over non-IMQ treated mice) at day 6 of indicated genes in the skin tissues of IMQ- and vehicle-treated, and IMQ- and HF-treated WT (Ifnar1+/+) and IFNAR1 SA mice (Ifnar1SA). Data show the means ± SEM (n=4-5). *, P <0.05. (f) Immunofluorescent analysis at day 6 of skin sections stained with DAPI (blue) and anti-CD45 (red) from IMQ- and vehicle-treated, and IMQ- and HF-treated WT (Ifnar1+/+) and IFNAR1 SA (Ifnar1SA) mice. Individual experiments were conducted 3 times with similar results, with 1 representative shown for each group. Scale bars (100 μm). (g) Quantitative analysis of CD45-positive cells in each section shown in f. Data are shown the means± SEM (n=5). *, P <0.05.

Similar articles

Cited by

References

    1. Afshar M, Martinez AD, Gallo RL, Hata TR. J Eur Acad Dermatol Venereol. 2013;27:771–8. - PMC - PubMed
    1. Baechler EC, Batliwalla FM, Reed AM, Peterson EJ, Gaffney PM, Moser KL, Gregersen PK, Behrens TW. Immunol Rev. 2006;210:120–37. - PubMed
    1. Bhattacharya S, HuangFu WC, Dong G, Qian J, Baker DP, Karar J, Koumenis C, Diehl JA, Fuchs SY. Oncogene. 2013;32:4214–21. - PMC - PubMed
    1. Bhattacharya S, HuangFu WC, Liu J, Veeranki S, Baker DP, Koumenis C, Diehl JA, Fuchs SY. J Biol Chem. 2010;285:2318–25. - PMC - PubMed
    1. Bhattacharya S, Katlinski KV, Reichert M, Takano S, Brice A, Zhao B, Yu Q, Zheng H, Carbone CJ, Katlinskaya YV, Leu NA, McCorkell KA, Srinivasan S, Girondo M, Rui H, May MJ, Avadhani NG, Rustgi AK, Fuchs SY. EMBO Mol Med. 2014;6:384–97. - PMC - PubMed

Publication types

MeSH terms