Expression of the MYB transcription factor gene BplMYB46 affects abiotic stress tolerance and secondary cell wall deposition in Betula platyphylla
- PMID: 27368149
- PMCID: PMC5253473
- DOI: 10.1111/pbi.12595
Expression of the MYB transcription factor gene BplMYB46 affects abiotic stress tolerance and secondary cell wall deposition in Betula platyphylla
Abstract
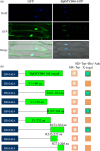
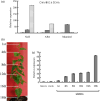
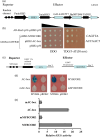
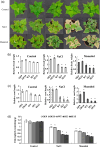
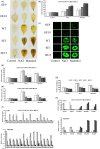
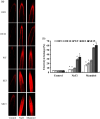
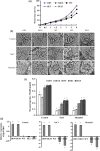
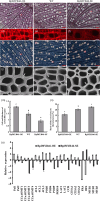
Plant MYB transcription factors control diverse biological processes, such as differentiation, development and abiotic stress responses. In this study, we characterized BplMYB46, an MYB gene from Betula platyphylla (birch) that is involved in both abiotic stress tolerance and secondary wall biosynthesis. BplMYB46 can act as a transcriptional activator in yeast and tobacco. We generated transgenic birch plants with overexpressing or silencing of BplMYB46 and subjected them to gain- or loss-of-function analysis. The results suggest that BplMYB46 improves salt and osmotic tolerance by affecting the expression of genes including SOD, POD and P5CS to increase both reactive oxygen species scavenging and proline levels. In addition, BplMYB46 appears to be involved in controlling stomatal aperture to reduce water loss. Overexpression of BplMYB46 increases lignin deposition, secondary cell wall thickness and the expression of genes in secondary cell wall formation. Further analysis indicated that BplMYB46 binds to MYBCORE and AC-box motifs and may directly activate the expression of genes involved in abiotic stress responses and secondary cell wall biosynthesis whose promoters contain these motifs. The transgenic BplMYB46-overexpressing birch plants, which have improved salt and osmotic stress tolerance, higher lignin and cellulose content and lower hemicellulose content than the control, have potential applications in the forestry industry.
Keywords: Betula platyphylla; BplMYB46; abiotic stress; secondary wall deposition.
© 2016 The Authors. Plant Biotechnology Journal published by Society for Experimental Biology and The Association of Applied Biologists and John Wiley & Sons Ltd.
Conflict of interest statement
The authors have no conflict of interest to declare.
Figures
Similar articles
-
BplMYB46 from Betula platyphylla Can Form Homodimers and Heterodimers and Is Involved in Salt and Osmotic Stresses.Int J Mol Sci. 2019 Mar 7;20(5):1171. doi: 10.3390/ijms20051171. Int J Mol Sci. 2019. PMID: 30866467 Free PMC article.
-
Identification of novel cis-elements bound by BplMYB46 involved in abiotic stress responses and secondary wall deposition.J Integr Plant Biol. 2018 Oct;60(10):1000-1014. doi: 10.1111/jipb.12671. Epub 2018 Jul 15. J Integr Plant Biol. 2018. PMID: 29877625
-
An Ethylene-responsive Factor BpERF11 Negatively Modulates Salt and Osmotic Tolerance in Betula platyphylla.Sci Rep. 2016 Mar 16;6:23085. doi: 10.1038/srep23085. Sci Rep. 2016. PMID: 26980058 Free PMC article.
-
A review of xylan and lignin biosynthesis: foundation for studying Arabidopsis irregular xylem mutants with pleiotropic phenotypes.Crit Rev Biochem Mol Biol. 2014 May-Jun;49(3):212-41. doi: 10.3109/10409238.2014.889651. Epub 2014 Feb 24. Crit Rev Biochem Mol Biol. 2014. PMID: 24564339 Review.
-
MdMYB46 could enhance salt and osmotic stress tolerance in apple by directly activating stress-responsive signals.Plant Biotechnol J. 2019 Dec;17(12):2341-2355. doi: 10.1111/pbi.13151. Epub 2019 May 26. Plant Biotechnol J. 2019. PMID: 31077628 Free PMC article. Review.
Cited by
-
The TuMYB46L-TuACO3 module regulates ethylene biosynthesis in einkorn wheat defense to powdery mildew.New Phytol. 2020 Mar;225(6):2526-2541. doi: 10.1111/nph.16305. Epub 2019 Dec 16. New Phytol. 2020. PMID: 31675430 Free PMC article.
-
Lignins: Biosynthesis and Biological Functions in Plants.Int J Mol Sci. 2018 Jan 24;19(2):335. doi: 10.3390/ijms19020335. Int J Mol Sci. 2018. PMID: 29364145 Free PMC article. Review.
-
QTL Identification for Stem Fiber, Strength and Rot Resistance in a DH Population from an Alien Introgression of Brassica napus.Plants (Basel). 2022 Jan 29;11(3):373. doi: 10.3390/plants11030373. Plants (Basel). 2022. PMID: 35161354 Free PMC article.
-
Genome-Wide Identification of MYB Transcription Factors and Screening of Members Involved in Stress Response in Actinidia.Int J Mol Sci. 2022 Feb 19;23(4):2323. doi: 10.3390/ijms23042323. Int J Mol Sci. 2022. PMID: 35216440 Free PMC article.
-
Lignin biosynthesis and accumulation in response to abiotic stresses in woody plants.For Res (Fayettev). 2022 Jul 12;2:9. doi: 10.48130/FR-2022-0009. eCollection 2022. For Res (Fayettev). 2022. PMID: 39525415 Free PMC article. Review.
References
-
- Bates, L.S. , Waldren, R.P. and Teare, J.D. (1973) Rapid determination of free proline for water stress studies. Plant Soil, 39, 205–207.
-
- Cedroni, M.L. , Cronn, R.C. , Adams, K.L. , Wilkins, T.A. and Wendel, J.F. (2003) Evolution and expression of MYB genes in diploid and polyploid cotton. Plant Mol. Biol. 51, 313–325. - PubMed
-
- Chang, S. , Puryear, J. and Cairney, J. (1993) A simple and efficient method for isolating RNA from pine trees. Plant Mol. Biol. Rep. 11, 113–116.
MeSH terms
Substances
Associated data
- Actions
- Actions
- Actions
- Actions
- Actions
- Actions
- Actions
- Actions
- Actions
- Actions
- Actions
- Actions
- Actions
- Actions
- Actions
- Actions
- Actions
- Actions
- Actions
- Actions
- Actions
- Actions
- Actions
- Actions
- Actions
- Actions
- Actions
- Actions
- Actions
- Actions
LinkOut - more resources
Full Text Sources
Other Literature Sources
Miscellaneous

