

Proteomic Screening and Lasso Regression Reveal Differential Signaling in Insulin and Insulin-like Growth Factor I (IGF1) Pathways
- PMID: 27364358
- PMCID: PMC5013316
- DOI: 10.1074/mcp.M115.057729
Proteomic Screening and Lasso Regression Reveal Differential Signaling in Insulin and Insulin-like Growth Factor I (IGF1) Pathways
Abstract
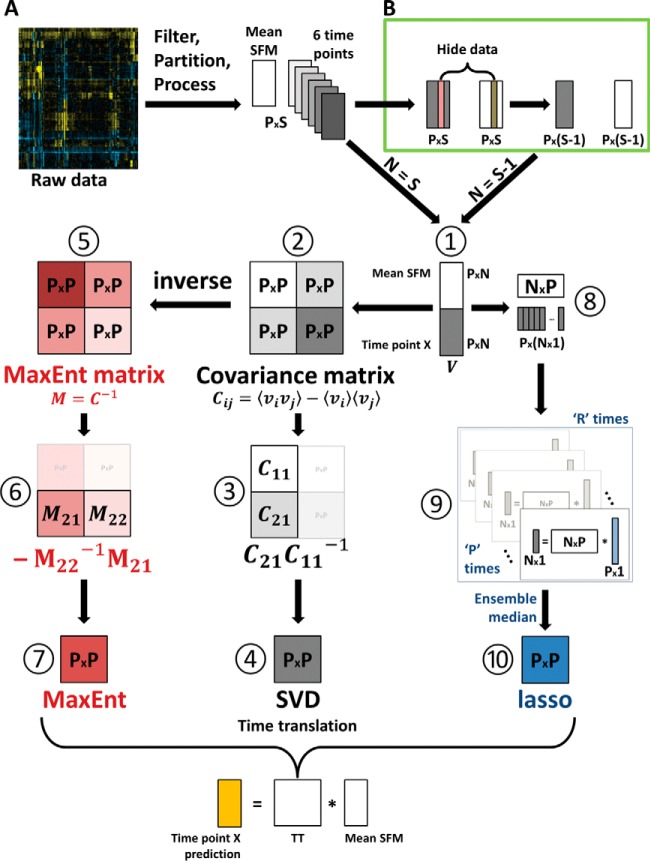
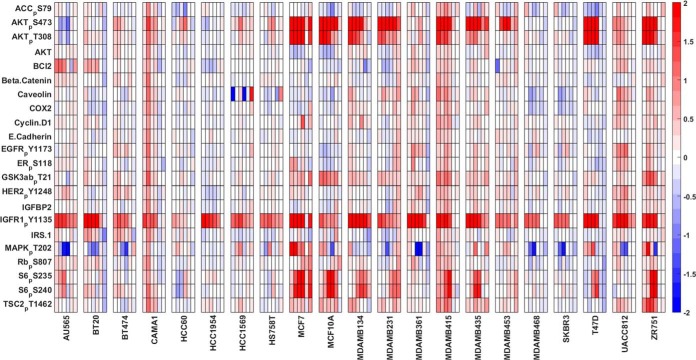
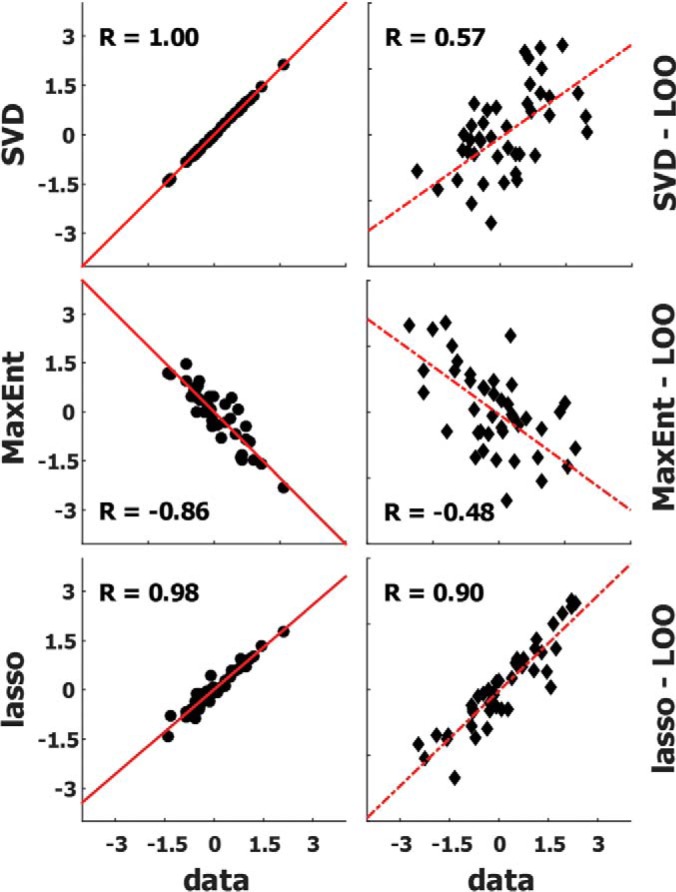
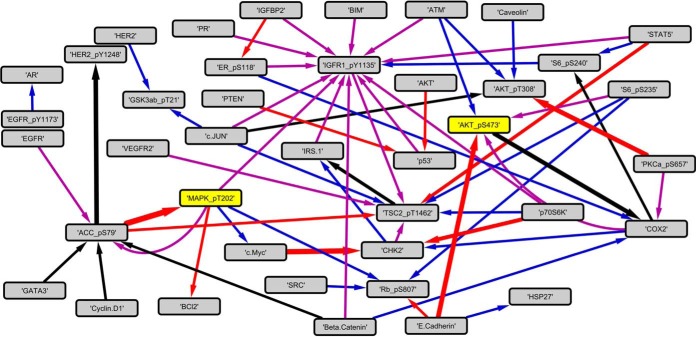
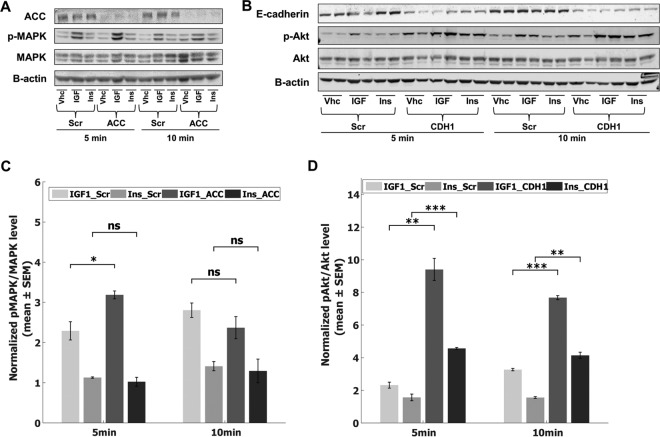
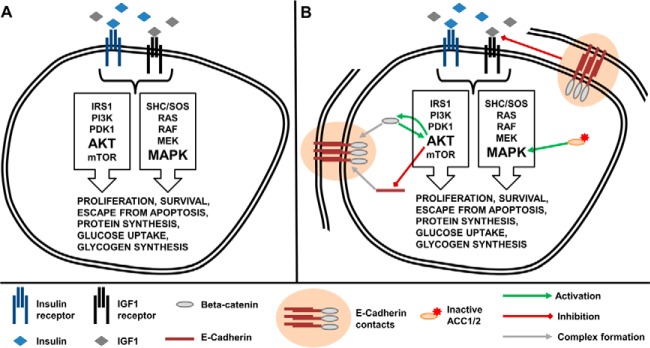
Insulin and insulin-like growth factor I (IGF1) influence cancer risk and progression through poorly understood mechanisms. To better understand the roles of insulin and IGF1 signaling in breast cancer, we combined proteomic screening with computational network inference to uncover differences in IGF1 and insulin induced signaling. Using reverse phase protein array, we measured the levels of 134 proteins in 21 breast cancer cell lines stimulated with IGF1 or insulin for up to 48 h. We then constructed directed protein expression networks using three separate methods: (i) lasso regression, (ii) conventional matrix inversion, and (iii) entropy maximization. These networks, named here as the time translation models, were analyzed and the inferred interactions were ranked by differential magnitude to identify pathway differences. The two top candidates, chosen for experimental validation, were shown to regulate IGF1/insulin induced phosphorylation events. First, acetyl-CoA carboxylase (ACC) knock-down was shown to increase the level of mitogen-activated protein kinase (MAPK) phosphorylation. Second, stable knock-down of E-Cadherin increased the phospho-Akt protein levels. Both of the knock-down perturbations incurred phosphorylation responses stronger in IGF1 stimulated cells compared with insulin. Overall, the time-translation modeling coupled to wet-lab experiments has proven to be powerful in inferring differential interactions downstream of IGF1 and insulin signaling, in vitro.
© 2016 by The American Society for Biochemistry and Molecular Biology, Inc.
Figures
Similar articles
-
Upregulation of IRS1 Enhances IGF1 Response in Y537S and D538G ESR1 Mutant Breast Cancer Cells.Endocrinology. 2018 Jan 1;159(1):285-296. doi: 10.1210/en.2017-00693. Endocrinology. 2018. PMID: 29029116 Free PMC article.
-
Multiple signaling pathways mediate interleukin-4-induced 3beta-hydroxysteroid dehydrogenase/delta5-delta4 isomerase type 1 gene expression in human breast cancer cells.Mol Endocrinol. 2000 Feb;14(2):229-40. doi: 10.1210/mend.14.2.0416. Mol Endocrinol. 2000. PMID: 10674396
-
Membrane-to-nucleus signaling links insulin-like growth factor-1- and stem cell factor-activated pathways.PLoS One. 2013 Oct 7;8(10):e76822. doi: 10.1371/journal.pone.0076822. eCollection 2013. PLoS One. 2013. PMID: 24116170 Free PMC article.
-
GPER mediates the angiocrine actions induced by IGF1 through the HIF-1α/VEGF pathway in the breast tumor microenvironment.Breast Cancer Res. 2017 Dec 6;19(1):129. doi: 10.1186/s13058-017-0923-5. Breast Cancer Res. 2017. PMID: 29212519 Free PMC article.
-
Differential Effects of Insulin and IGF1 Receptors on ERK and AKT Subcellular Distribution in Breast Cancer Cells.Cells. 2019 Nov 23;8(12):1499. doi: 10.3390/cells8121499. Cells. 2019. PMID: 31771180 Free PMC article.
Cited by
-
Harnessing Human Microphysiology Systems as Key Experimental Models for Quantitative Systems Pharmacology.Handb Exp Pharmacol. 2019;260:327-367. doi: 10.1007/164_2019_239. Handb Exp Pharmacol. 2019. PMID: 31201557 Free PMC article.
-
Breast tumor IGF1R regulates cell adhesion and metastasis: alignment of mouse single cell and human breast cancer transcriptomics.Front Oncol. 2022 Dec 7;12:990398. doi: 10.3389/fonc.2022.990398. eCollection 2022. Front Oncol. 2022. PMID: 36568144 Free PMC article.
-
Loss of E-cadherin Enhances IGF1-IGF1R Pathway Activation and Sensitizes Breast Cancers to Anti-IGF1R/InsR Inhibitors.Clin Cancer Res. 2018 Oct 15;24(20):5165-5177. doi: 10.1158/1078-0432.CCR-18-0279. Epub 2018 Jun 25. Clin Cancer Res. 2018. PMID: 29941485 Free PMC article.
-
Biomarkers of Insulin and the Insulin-Like Growth Factor Axis in Relation to Breast Cancer Risk in Chinese Women.Onco Targets Ther. 2020 Aug 11;13:8027-8036. doi: 10.2147/OTT.S258357. eCollection 2020. Onco Targets Ther. 2020. PMID: 32848423 Free PMC article.
-
Loss of E-cadherin Induces IGF1R Activation and Reveals a Targetable Pathway in Invasive Lobular Breast Carcinoma.Mol Cancer Res. 2022 Sep 2;20(9):1405-1419. doi: 10.1158/1541-7786.MCR-22-0090. Mol Cancer Res. 2022. PMID: 35665642 Free PMC article.
References
-
- Casa A. J., Dearth R. K., Litzenburger B. C., Lee A. V., and Cui X. (2008) The type I insulin-like growth factor receptor pathway: a key player in cancer therapeutic resistance. Frontiers Biosci. 13, 3273–3287 - PubMed
-
- Sachdev D., and Yee D. (2001) The IGF system and breast cancer. Endocrine-Related Cancer 8, 197–209 - PubMed
-
- Casa A., Litzenburger B., Dearth R., and Lee A. v. (2008) Insulin-like growth factor signaling in normal mammary gland development and breast cancer progression. Breast Cancer: Prognosis, Treatment and Prevention, CRC Press, Boca Raton FL, pp. 303–322, 2nd Ed Informa Healthcare, New York
-
- Liu J. L., and LeRoith D. (1999) Insulin-like growth factor I is essential for postnatal growth in response to growth hormone. Endocrinology 140, 5178–5184 - PubMed
Publication types
MeSH terms
Substances
Grants and funding
LinkOut - more resources
Full Text Sources
Other Literature Sources
Medical
Molecular Biology Databases
Miscellaneous
