. 2016 Jun 30;11(6):e0157290.
doi: 10.1371/journal.pone.0157290. eCollection 2016.

Phosphoproteome and Transcriptome of RA-Responsive and RA-Resistant Breast Cancer Cell Lines

Affiliations

Phosphoproteome and Transcriptome of RA-Responsive and RA-Resistant Breast Cancer Cell Lines

Marilyn Carrier et al. PLoS One. .

Abstract

Retinoic acid (RA), the main active vitamin A metabolite, controls multiple biological processes such as cell proliferation and differentiation through genomic programs and kinase cascades activation. Due to these properties, RA has proven anti-cancer capacity. Several breast cancer cells respond to the antiproliferative effects of RA, while others are RA-resistant. However, the overall signaling and transcriptional pathways that are altered in such cells have not been elucidated. Here, in a large-scale analysis of the phosphoproteins and in a genome-wide analysis of the RA-regulated genes, we compared two human breast cancer cell lines, a RA-responsive one, the MCF7 cell line, and a RA-resistant one, the BT474 cell line, which depicts several alterations of the "kinome". Using high-resolution nano-LC-LTQ-Orbitrap mass spectrometry associated to phosphopeptide enrichment, we found that several proteins involved in signaling and in transcription, are differentially phosphorylated before and after RA addition. The paradigm of these proteins is the RA receptor α (RARα), which was phosphorylated in MCF7 cells but not in BT474 cells after RA addition. The panel of the RA-regulated genes was also different. Overall our results indicate that RA resistance might correlate with the deregulation of the phosphoproteome with consequences on gene expression.


Conflict of interest statement

Competing Interests: The authors have declared that no competing interests exist.

Figures

Fig 1
Fig 1. Workflow for the phosphoproteomics strategy.
(A) Phosphoproteome. Nuclear and cytoplasmic extracts were prepared and divided in two: one half was digested with trypsin/Lys-C and the other half with chymotrypsin. A small fraction of the trypsin/Lys-C digests was analyzed directly without further purification. The remaining digests were subjected to phosphopeptide enrichment and MS analysis. (B) RARα phosphorylation. Whole cell extracts were prepared from MCF7 and BT474 cells with and without a 30 min RA treatment. RARα was immunoprecipitated and the eluates were thermolysin-digested. Phosphopeptides were enriched and analyzed by nano-LC-LTQ-Orbitrap MS.
Fig 2
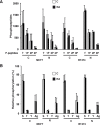
Fig 2. Overview of phosphorylation in MCF7 and BT474 cells.
(A) Relative frequency of mono- (1P), bi-(2P) and tri- (3P) phosphorylated peptides in the cytosolic and nuclear extracts of MCF7 and BT474 cells with and without RA treatment. T: total number of phosphopeptides. C: cytosolic extracts, N: nuclear extracts. (B) Relative phosphorylation of Serine (S), Thr (T) and Tyr (Y) residues (Ag: ambiguous). The values are the average ±SD of two experiments.
Fig 3
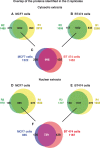
Fig 3. Overlap of the total proteins identified in the two replicate experiments R1 and R2.
(A) Overlap of the MCF7 cytosolic proteins identified in the replicate experiments R1 and R2 (B) Overlap of the BT474 cytosolic proteins identified in R1 and R2 (C) Overlap of the MCF7 and BT474 cytosolic proteins. (D) Overlap of the MCF7 nuclear proteins identified in R1 and R2 (E) Overlap of the BT474 nuclear proteins identified in R1 and R2 (C) Overlap of the MCF7 and BT474 nuclear proteins.
Fig 4
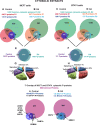
Fig 4. Comparison of the phosphorylated proteins in the cytosolic extracts of MCF7 and BT474 cells.
(A and B) Overlap of the cytosolic phosphorylated proteins of MCF7 cells identified in the two replicate experiments R1 and R2. The phosphoproteins identified in the cytosolic extracts of MCF7 cells without (A) or with (B) RA treatment, in each replicate, were crossed with each other and with the common proteins identified in Fig 3. (C and D) Same for BT474 cells. (E and F) Overlap of the phosphorylated proteins identified in the absence and in the presence of RA in the cytosolic extracts of MCF7 (E) and BT474 cells (F). (G and H) 3D pie charts showing the biologic functions of the cytosolic P-proteins identified in MCF7 (G) and BT474 (H) cells. (I) Overlap of the cytosolic phosphoproteins identified in MCF7 and BT474 cells in the absence (a) and in the presence of RA (b).
Fig 5
Fig 5. List of phosphoproteins, grouped per biological functions that were detected in the cytosolic extracts of MCF7 and/or BT474 cells, in the two replicate experiments.
For each protein, the phosphopeptides were analyzed manually. The site classes are assigned as acidic (A), basic (B) or proline-directed (P). Phosphoproteins detected in both cell lines (Black), in MCF7 cells only (Green) or in BT474 cells only (Blue). Indicated is whether phosphorylation occurs in the absence of RA only (-), in the presence of RA only (+) or both in the absence and presence of RA (±).
Fig 6
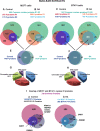
Fig 6. Comparison of the phosphorylated proteins in the nuclear extracts of MCF7 and BT474 cells.
(A and B) Overlap of the phosphorylated nuclear proteins of MCF7 cells identified in the two replicate experiments R1 and R2, in the absence (A) or in the presence (B) of RA. (C and D) Same for the phosphoproteins identified in the nuclear extracts of BT474 cells. (E and F) Overlap of the nuclear phosphorylated proteins identified in the absence and in the presence of RA in MCF7 (E) and BT474 cells (F). (G and H) 3D pie charts showing the biological functions of the nuclear phosphoproteins identified in MCF7 (G) and BT474 (H) cells. (I) Overlap of the nuclear phosphoproteins identified in MCF7 and BT474 cells in the absence (a) and in the presence of RA (b).
Fig 7
Fig 7. List of phosphoproteins, grouped per biological functions that were detected in the nuclear extracts of MCF7 and/or BT474 cells, in the two replicate experiments.
For each protein, the phosphopeptides were analyzed manually. The site classes are assigned as acidic (A), basic (B) or proline-directed (P). Phosphoproteins detected in both cell lines (Black), in MCF7 cells only (Green) or in BT474 cells only (Blue). Indicated is whether phosphorylation occurs in the absence of RA only (-), in the presence of RA only (+) or both in the absence and presence of RA (±).
Fig 8
Fig 8
RARα sequence coverage upon digestion with trypsin (A) or thermolysin (B). Simulation was performed using PeptideMass Peptide characterization software (Expasy). In red are the obtained peptides.
Fig 9
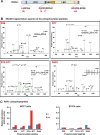
Fig 9. Comparison of the RARα phosphorylation sites in MCF7 and BT474 cells.
(A) Schematic representation of the RARα domains with the S36, S74, S77 and S445 phosphosites. (B) MS-MS fragmentation spectra of the phosphorylated peptides. (C) Relative abundance of the RARα phosphopeptides in MCF7 (left) and BT474 cells (right) with and without RA treatment. Peptides numbers were normalized to the protein content of the immunoprecipitation eluates. The values are the average ±20% of two separate experiments.
Fig 10
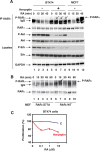
Fig 10. Validation of RARα phosphorylation at S74 and S77.
(A). Kinetics experiments showing that RA induces the phosphorylation of RARα at both S74 and S77 in MCF7 cells and not in BT474 cells and that Herceptin (100μg/ml) restores partially RARα phosphorylation. Cell extracts were immunoprecipitated with antibodies recognizing specifically RARα phosphorylated at both S74 and S77 (Ab36α). The eluates were resolved by SDS-PAGE and immunoblotted with RPα(F). Herceptin also decreases the phosphorylation of Akt and Erks. An arrow indicates the band corresponding to the phosphorylated form of RARα. (B). Kinetics experiments showing that RA also induces the phosphorylation of RARα at both S74 and S77 in MEFs expressing RARαWT in a triple RAR null background. No increase was observed in MEFs expressing RARαS77A. Extracts were immunoprecipitated with Ab36α as in A. (C) Herceptin restores the antiproliferative effect of RA on BT474 cells. When 50% confluent, BT474 cells were treated with increasing concentrations of RA in the absence or presence of Herceptin (100μg/ml). Cell proliferation was analyzed after 48h using the XTT (2,3bis-(2methoxy-4-nitro-5sulfophenyl)-2H-tetrazolium-5-carboxanilide) assay kit.
Fig 11
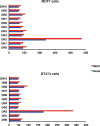
Fig 11. DR (DR0-DR10) in the MCF7 and BT474 RA-regulated genes.
The frequencies of the different DRs and of genes with DRs are shown.
Fig 12
Fig 12. Comparison of the RA-regulated genes in MCF7 and BT474 cells.
(A) Venn diagram showing that 80% of the genes that are RA-regulated in MCF7 cells are not in BT474 cells. (B) and (C) 3D pie charts showing the categories of genes that are RA-regulated in MCF7 only and in BT474 cells only. The genes were selected using the Manteia GO statistical analysis on GO analysis with a P value <0,01. (D) Heatmaps showing the genes that are RA-regulated in both cell lines.
Fig 13
Fig 13. ChIP-qPCR analysis of RARα recruitment at the Cy26a1 gene promoter.
(A) Kinetic ChIP experiments performed with RA-treated MCF7 and BT474 cells and determining the recruitment of RARα to the R1 and R2 response elements of the Cyp26a1 gene. Values correspond to a representative experiment among 3. (B) ChIP experiments performed with MEFs expressing RARαWT or RARαS77A and determining the recruitment of RARα to the R1 and R2 elements of the Cyp26a1 gene. Values are the mean ±SD of three experiments.

Similar articles

Cited by

References

    1. Rochette-Egly C, Germain P. Dynamic and combinatorial control of gene expression by nuclear retinoic acid receptors. Nuclear Receptor Signaling. 2009;7:e005 10.1621/nrs.07005 - DOI - PMC - PubMed
    1. Samarut E, Rochette-Egly C. Nuclear retinoic acid receptors: conductors of the retinoic acid symphony during development. Mol Cell Endocrinol. 2012;348(2):348–60. Epub 2011/04/21. 10.1016/j.mce.2011.03.025 . - DOI - PubMed
    1. Moutier E, Ye T, Choukrallah MA, Urban S, Osz J, Chatagnon A, et al. Retinoic acid receptors recognise the mouse genome through binding elements with diverse spacing and topology. J Biol Chem. 2012;287(31):26328–41. Epub 2012/06/05. 10.1074/jbc.M112.361790 . - DOI - PMC - PubMed
    1. Carroll JS, Meyer CA, Song J, Li W, Geistlinger TR, Eeckhoute J, et al. Genome-wide analysis of estrogen receptor binding sites. Nat Genet. 2006;38(11):1289–97. Epub 2006/10/03. 10.1038/ng1901 . - DOI - PubMed
    1. Hua S, Kittler R, White KP. Genomic antagonism between retinoic acid and estrogen signaling in breast cancer. Cell. 2009;137(7):1259–71. Epub 2009/07/01. 10.1016/j.cell.2009.04.043 . - DOI - PMC - PubMed

MeSH terms

Grants and funding

This work was supported by funds from CNRS, INSERM and by funds raised by CRE from the Agence Nationale pour la Recherche (ANR-09-BLAN-0297-01, www.agence-nationale-recherche.fr), the Association pour la recherche sur le Cancer (SL 220110603474 and PJA20141201746, www.fondation-arc.org), the Fondation pour la Recherche Médicale (FRM, DEQ20090515423, www.frm.org), and the Institut National du Cancer (PL09-194, www.e-cancer.fr). It was also supported by ANR-10-LABX-0030-INRT, a French State fund managed by the ANR under the frame programme Investissements d’Avenir labeled ANR-10-IDEX-0002-02. ARC supported the acquisition of the Orbitrap mass spectrometer. The Canceropole Grand Est supported MJ. The Ligue nationale contre le cancer supported MC. The funders had no role in study design, data collection and analysis, decision to publish, or preparation of the manuscript.