Loading [MathJax]/jax/output/PreviewHTML/jax.js
Skip to main page content
U.S. flag

An official website of the United States government

Access keys NCBI Homepage MyNCBI Homepage Main Content Main Navigation
. 2016 Jun 29;11(6):e0158305.
doi: 10.1371/journal.pone.0158305. eCollection 2016.

Dynamic Regulation of Cell Volume and Extracellular ATP of Human Erythrocytes

Affiliations

Dynamic Regulation of Cell Volume and Extracellular ATP of Human Erythrocytes

M Florencia Leal Denis et al. PLoS One. .

Abstract

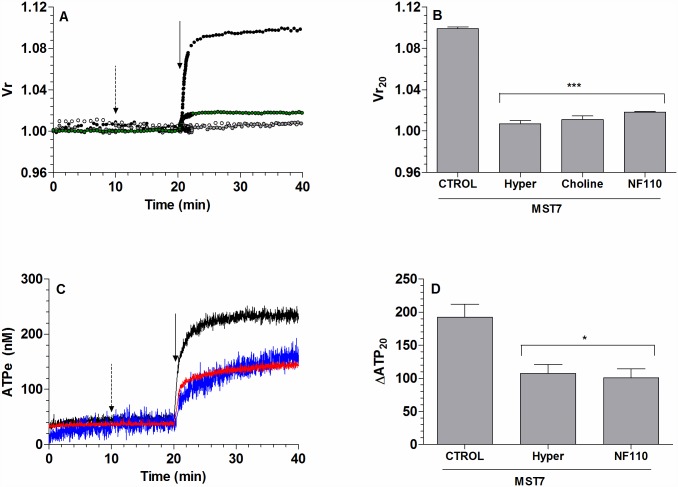
Introduction: The peptide mastoparan 7 (MST7) triggered in human erythrocytes (rbcs) the release of ATP and swelling. Since swelling is a well-known inducer of ATP release, and extracellular (ATPe), interacting with P (purinergic) receptors, can affect cell volume (Vr), we explored the dynamic regulation between Vr and ATPe.

Methods and treatments: We made a quantitative assessment of MST7-dependent kinetics of Vr and of [ATPe], both in the absence and presence of blockers of ATP efflux, swelling and P receptors.

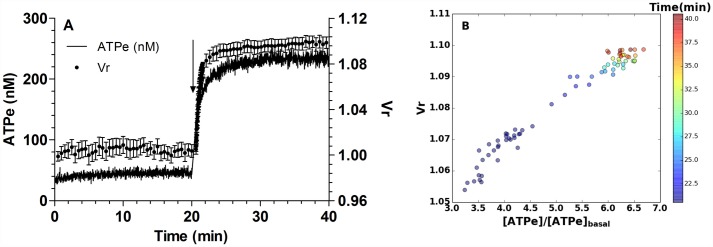
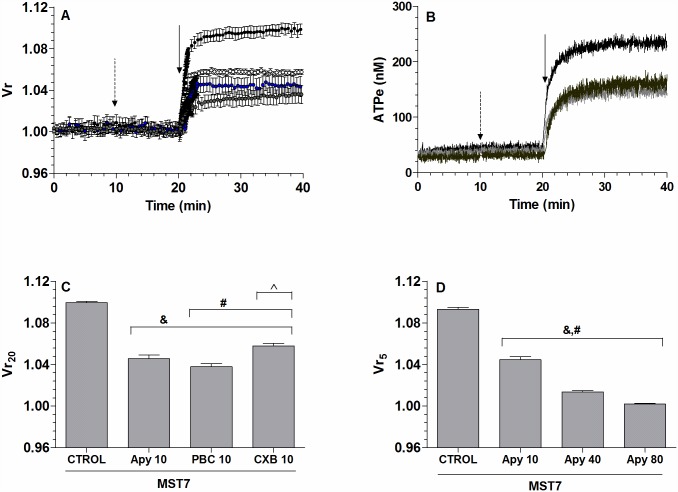
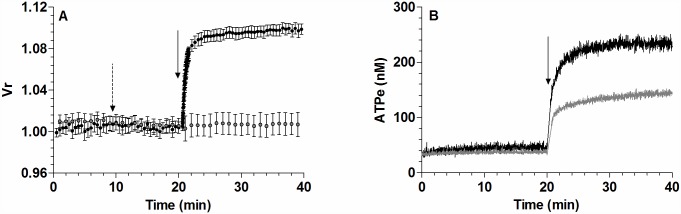
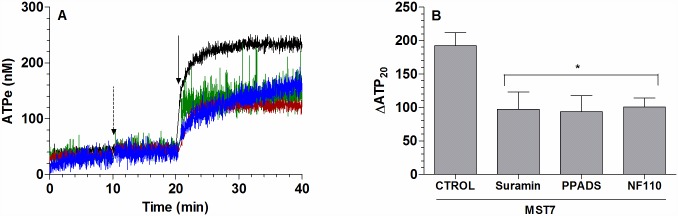
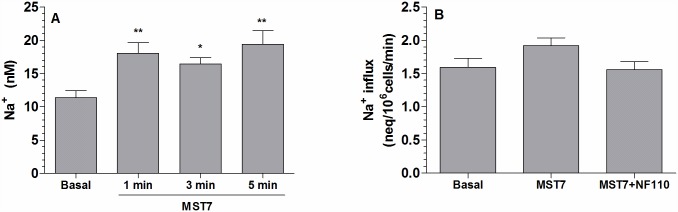
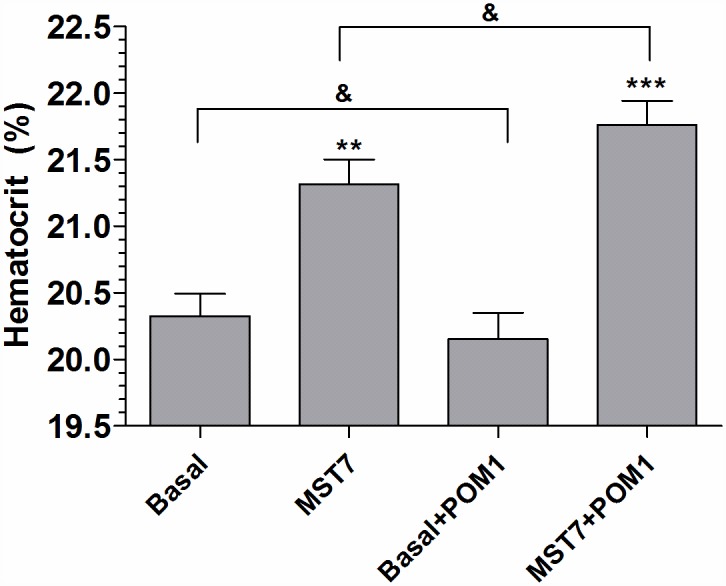
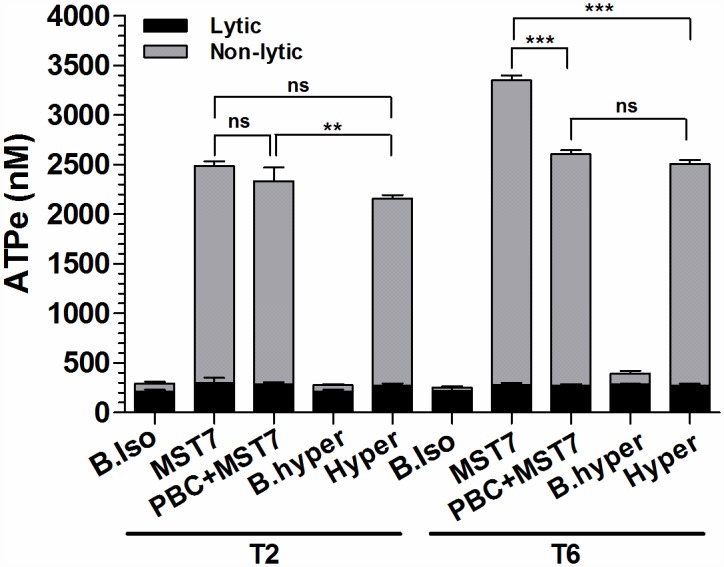
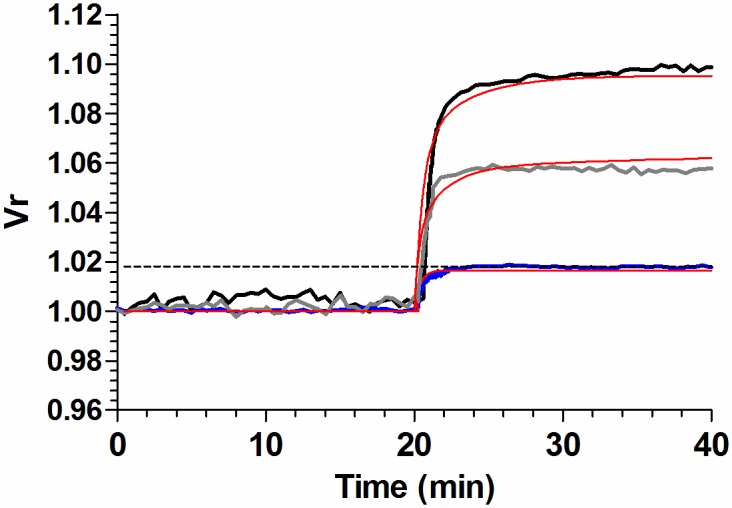
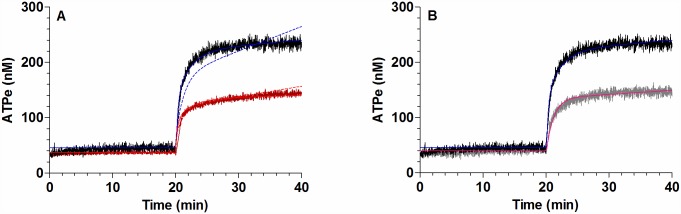
Results: In rbcs 10 μM MST7 promoted acute, strongly correlated changes in [ATPe] and Vr. Whereas MST7 induced increases of 10% in Vr and 190 nM in [ATPe], blocking swelling in a hyperosmotic medium + MST7 reduced [ATPe] by 40%. Pre-incubation of rbcs with 10 μM of either carbenoxolone or probenecid, two inhibitors of the ATP conduit pannexin 1, reduced [ATPe] by 40-50% and swelling by 40-60%, while in the presence of 80 U/mL apyrase, an ATPe scavenger, cell swelling was prevented. While exposure to 10 μM NF110, a blocker of ATP-P2X receptors mediating sodium influx, reduced [ATPe] by 48%, and swelling by 80%, incubation of cells in sodium free medium reduced swelling by 92%.

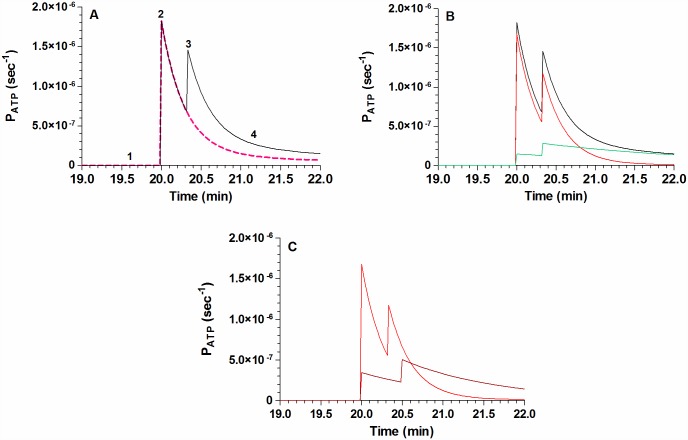
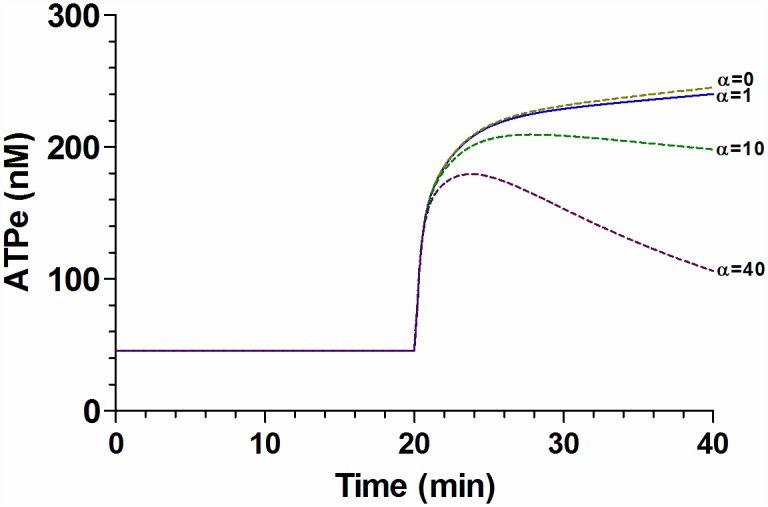
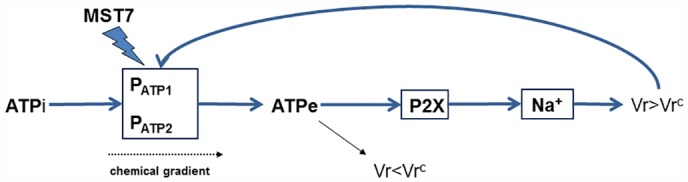
Analysis and discussion: Results were analyzed by means of a mathematical model where ATPe kinetics and Vr kinetics were mutually regulated. Model dependent fit to experimental data showed that, upon MST7 exposure, ATP efflux required a fast 1960-fold increase of ATP permeability, mediated by two kinetically different conduits, both of which were activated by swelling and inactivated by time. Both experimental and theoretical results suggest that, following MST7 exposure, ATP is released via two conduits, one of which is mediated by pannexin 1. The accumulated ATPe activates P2X receptors, followed by sodium influx, resulting in cell swelling, which in turn further activates ATP release. Thus swelling and P2X receptors constitute essential components of a positive feedback loop underlying ATP-induced ATP release of rbcs.


Conflict of interest statement

Competing Interests: The authors have declared that no competing interests exist.

Figures

Fig 1
Fig 1. ATPe and Vr kinetics of MST7-exposed rbcs.
(A)Time course of [ATPe] and relative cell volume (Vr) of rbcs exposed to MST7. Rbcs were incubated 20 min in isosmotic medium (300 mosM), after which 10 μM MST7 was added. ATPe concentration was expressed in nM for 3 106 cells assayed in 40 μL of medium (black line, N = 9, n = 15). Vr is a dimensionless quantity; values are expressed as means ± SE of 20–30 rbcs (●, N = 6). Calibration of Vr was performed at the end of each experiment by sequentially exposing rbcs to assay media with the following osmolarities (in mosM) 298, 287, 260 and 245 (see Fig A in S1 File). Calibration of [ATPe] was carried out using fixed concentrations of exogenous ATP dissolved in isosmotic medium (not shown). The arrow indicates exposure to 10 μM MST7. Numbers of determinations (n) from independent preparations (N) are indicated. (B) Correlation between Vr and [ATPe]. Data from A was plotted as Vr against [ATPe] at different times of MST7 exposure. [ATPe] was expressed relative to the basal ATPe concentration measured in the pre-stimulus phase. Colors for symbols reflect the time after MST7 addition according to the time scale shown on the right.
Fig 2
Fig 2. Effect of ATP release on the kinetics of Vr and [ATPe].
(A) Time course of Vr for rbcs exposed to MST7. BCECF-loaded rbcs were incubated in 200 μL isosmotic medium in the absence or presence of 10 μM CBX (○), 10 μM PBC (), or 10 U/mL apyrase (Apy, ). After 20 min, 10 μM MST7 was added. Results are means ± SE of 20–30 rbcs for CBX (N = 4), PBC (N = 3) and apyrase (N = 3). The dashed arrow indicates addition of treatment and the full arrow indicates exposure to 10 μM MST7. Numbers of independent preparations (N) are indicated. (B) Time course of [ATPe] for rbcs exposed to MST7. Rbcs were incubated in 40 μL isosmotic medium in the absence or presence of 10 μM CBX (light grey line, N = 5, n = 8) or 10 μM PBC (dark grey line, N = 3, n = 5). After 20 min, 10 μM MST7 was added. The dashed arrow indicates addition of blockers and the full arrow indicates exposure to MST7. Numbers of determinations (n) from independent preparations (N) are indicated. (C) Degree of swelling derived from results shown in A. Results are given as Vr20, i.e., the Vr value at 20 min post MST7 exposure. Results are means ± SEM (&, p < 0.001 versus CTROL, MST7 alone; #, p < 0.01 versus Apy; ^, p < 0.001 versus PBC10). (D) Effect of apyrase on swelling. BCECF-loaded rbcs were pre-incubated for 10 min with 10, 40 or 80 U/mL Apy, followed by exposure to 10 μM MST7 for 5 min. The degree of swelling was expressed as Vr5, i.e., the Vr value at 5 min post MST7 exposure. Results are means ± SEM (&, p < 0.001 versus CTROL, MST7 alone; #, p < 0.001 among apyrase concentrations). CBX = carbenoxolone; PBC = probenecid, Apy = apyrase. Calibrations of Vr and [ATPe] were performed as in Fig 1.
Fig 3
Fig 3. Effect of hyperosmotic medium on kinetics of Vr and [ATPe].
(A) Time course of Vr for rbcs exposed to MST7. BCECF-loaded rbcs were incubated 20 min in 200 μL of isosmotic medium (300 mosM), followed by exposure to 10 μM MST7 dissolved in isosmotic medium (●) or in hyperosmotic medium (, 345 mosM). Results are means ± SE of 20–30 rbcs (N = 6) for isosmotic medium and 20–30 rbcs (N = 4) for hyperosmotic medium. Calibration was performed at the end of each experiment by sequentially exposing rbcs to assay media with the following osmolarities (in mosM) 287, 260, 245 or 312, 323 and 340 (see Fig A in S1 File). The arrow indicates exposure to 10 μM MST7. Numbers of independent preparations (N) are indicated. (B) Time course of [ATPe] for rbcs exposed to MST7. Rbcs were stimulated with 10 μM MST7 dissolved in isosmotic medium (black line; N = 9, n = 15) or in hyperosmotic medium (gray line; N = 3, n = 5). [ATPe] was expressed in nM for 3 106 cells assayed in 40 μL of medium. The arrow indicates exposure to stimulus. Numbers of determinations (n) from independent preparations (N) are indicated. Calibrations of Vr and [ATPe] were performed as in Fig 1.
Fig 4
Fig 4. Effect of P receptors on ATPe kinetics.
(A) Time course of [ATPe] for rbcs exposed to MST7. Rbcs were incubated in 40 μL medium in the absence or presence of the following P receptor antagonists: 100 μM suramin (green line, N = 5, n = 6), 100 μM PPADS (brown line, N = 5, n = 6) or 10 μM NF110 (blue line, N = 3, n = 5). After 20 min, 10 μM MST7 was added. The dashed arrow indicates addition of blockers and the full arrow indicates exposure to MST7. Numbers of determinations (n) from independent preparations (N) are indicated. ATPe was expressed in nM for 3 106 cells assayed in 40 μL of medium. (B) Values of [ATPe] increase using data from A. Values are expressed as ΔATP20, i.e., the difference between [ATPe] at 20 min post stimulus and basal [ATPe]. Results are means ± SEM (*, p < 0.05 versus CTROL, MST7 alone) and are expressed in nM for 3 106 cells assayed in 40 μL of medium. Calibration of [ATPe] was performed as in Fig 1.
Fig 5
Fig 5. Effect of P2X receptor and sodium on the kinetics of Vr and ATPe.
(A) Vr kinetics. BCECF-loaded rbcs were incubated in isosmotic medium. After 10 min the medium was replaced by a sodium free isosmotic medium () or an isosmotic medium containing 10 μM NF110 (). Kinetics of Vr for rbcs exposed to MST7 in isosmotic (●) and hyperosmotic (○) media are shown for comparison. Calibration was performed as in Fig 1. Results are means ± SE of 20–30 rbcs (isosmotic medium, N = 6; NF110, N = 4; Choline, N = 3) and 30–40 rbcs for hyperosmotic medium (N = 4). The dashed arrow indicates addition of blocker and the full arrow indicates addition of MST7. (B) Degree of swelling obtained from A. Values are expressed as Vr20, i.e., the Vr value at 20 min post stimulus. Results are means ± SEM (***, p < 0.001 versus CTROL, MST7 alone). (C) ATPe kinetics. Rbcs were pre-incubated with 10 μM NF110 (blue line, N = 3, n = 5) for 10 min before exposure to 10 μM MST7. ATPe kinetics for MST7 in isosmotic (black line) and hyperosmotic (red line) media are shown for comparison. Results are expressed in nM for 3 106 cells in 40 μL assay medium. The dashed arrow indicates addition of blocker and the full arrow indicates addition of MST7. (D) Values of [ATPe] increase using data from C. Values are expressed as ΔATP20, i.e., the difference between [ATPe] at 20 min post stimulus and basal [ATPe]. Results are means ± SEM. (*, p < 0.05 versus CTROL, MST7 alone) and are expressed in nM for 3 106 cells assayed in 40 μL of medium. Calibrations of Vr and [ATPe] were performed as in Fig 1.
Fig 6
Fig 6. Effect of MST7 on intracellular sodium content.
(A) Rbcs were exposed to isosmotic medium in the absence or presence of 10 μM MST7 for 1, 3 or 5 min. Cells were then lysed and sodium content was measured by capillary electrophoresis. Results (Na+) were expressed in mM. Values are means ± SEM (*, p < 0.05 versus Basal) (N = 3, n = 6–12). (B) Sodium uptake in the absence of MST7 (basal) and in the presence of MST7, both with and without pre-exposure to NF110. Experiments were run for 1 min following exposure to RBC medium containing 22NaCl ± 10 μM MST7. 10 μM NF110 was given 10 min before addition of radioactive label. Numbers of determinations (n) from independent preparations (N) are indicated.
Fig 7
Fig 7. Effect of MST7 on hematocrit of rbcs.
Rbcs were held in suspension in isosmotic medium at 20% hematocrit, and exposed 10 min to isosmotic medium in the absence and presence of POM1 (an ectoATPase inhibitor) followed by exposure to 10 μM MST7 for 2 min. Hematocrits were then determined, and expressed as percentage (%). Results are means ± SEM (N = 5, n = 46) (***, p < 0,001 versus Basal; **, p < 0,05 versus Basal + POM1; &: not significant). Numbers of determinations (n) from independent preparations (N) are indicated.
Fig 8
Fig 8. ATPe concentration of a suspension of rbcs exposed to MST7.
Rbcs were held in suspension in isosmotic medium (300 mosM) at 20% hematocrit and exposed to 10 μM MST7 for 2 and 6 min (T2 and T6 respectively). MST7 was added in the absence of additional treatments (MST7), or in the presence of hyperosmotic medium (Hyper, 345 mosM) or 10 μM probenecid (PBC). Controls were run in the absence of MST7, both in isosmotic (B.iso) as well as hyperosmotic (B. hyper) media. Assessment of hemolysis for each sample allowed to calculate the lytic contribution to ATPe concentration. Results are means of N = 3, n = 5. Numbers of determinations (n) from independent preparations (N) are indicated.
Fig 9
Fig 9. Model simulations of Vr kinetics in the absence and presence of blockers.
Model dependent fit to experimental Vr kinetics in the absence of blockers (control condition), and in the presence of 10 μM CBX or 10 μM NF110. Fitting was performed simultaneously to the three experimental conditions. MST7 was added at t = 20 min. Black, grey and blue lines correspond to experimental data of Figs 1A, 2A and 5A, respectively. Red lines show the best fitting curves to experimental data. The dashed line indicates the critical value of Vrc above which ATP release is triggered by swelling. Model for Vr kinetics is encoded in Eqs. A-B of S1 File, with values of best fit for the parameters given in Table A in S1 File.
Fig 10
Fig 10. Model simulations of [ATPe] kinetics.
(A) The lines represent the best fit of the model to experimental ATPe kinetics for rbcs exposed to MST7 in isosmotic and hyperosmotic media. Two ATP conduits were assumed to mediate ATP efflux. The model was run assuming that one (dashed lines) or both conduits (continuous lines) were sensitive to swelling. Experimental data was obtained from Fig 3B, and showed only for comparison. (B) The lines represent the best fit of the model to experimental ATPe kinetics for rbcs exposed to MST7 in the absence and presence of 10 μM CBX. Two Vr-sensitive ATP conduits were assumed. The model was run assuming that CBX blocked one ATP conduit and partially inhibited the second conduit. Experimental data was obtained from Fig 2B, and showed only for comparison. MST7 is added at t = 20 min. The model is described in S1 File, with best fitting values shown in Table A in S1 File.
Fig 11
Fig 11. Model prediction of ATP permeability (PATP).
Following model dependent fit to the experimentally observed ATP kinetics (Fig 10), the model predicted the corresponding permeabilities of ATP that mediate ATP exit. (A) Kinetics of PATP for rbcs exposed to MST7 in isosmotic medium (continuous line) or in hyperosmotic medium (dashed line). Labels 1–4 were added to divide the continuous time profile of PATP into four discrete phases: 1 = basal level of PATP. 2 = PATP activation by exposure to MST7. 3 = PATP activation by swelling, which occurred only in isosmotic medium (continuous line). 4 = time dependent inactivation of PATP. (B) Kinetics of PATP for each ATP conduit (PATP1 and PATP2, red and green, respectively) and their sum (black). (C) Kinetics of PATP1 in the absence of CBX (red, as in B), or in its presence (brown). According to the model, PATP2 is zero in the presence of CBX. Model parameters are shown in Table A in S1 File.
Fig 12
Fig 12. Model prediction for the effect of ectoATPase activity on ATPe kinetics.
The effect of ectoATPase activity on ATPe kinetics was evaluated by multiplying kATP, i.e., the parameter estimating ectoATPase activity (see S1 File), by a factor α. The continuous line shows the simulation of the best fit model for ATPe kinetics under MST7 exposure, i.e., α = 1, with kATP = 1.98 10−5 s-1. Predictions (dashed lines) were made for α = 0 (i.e., no ectoATPase activity), 10 or 40. MST7 is added at t = 20 min. Model parameters and their best fitting values are shown in Table A in S1 File.
Fig 13
Fig 13. Mutual regulation of ATPe and Vr.
The scheme summarizes the key features of this study. In rbcs, exposure to MST7 triggers activation of two ATP permeabilities (PATP1 and PATP2), causing [ATPe] kinetics. In the absence of P2X activation, swelling is activated by ATPe, but the magnitude of volume increase is so small that it does not trigger ATP efflux. This is shown as the arrow leading to Vr<Vrc. Activation of a P2X receptor by ATPe leads to sodium influx, coupled to water influx and swelling. As Vr increases, it surpasses Vrc (i.e., Vr>Vrc), so that PATP is transiently activated, leading to ATP release. ATPi and ATPe denote intracellular and extracellular ATP, respectively. The chemical gradient refers to the difference between ATPi and ATPe at both sides of the plasma membrane.

Similar articles

Cited by

References

    1. Sprague RS, Stephenson AH, Ellsworth ML. Red not dead: signaling in and from erythrocytes. Trends Endocrinol Metab. 2007;18: 350–5. 10.1016/j.tem.2007.08.008 - DOI - PubMed
    1. Montalbetti N, Leal Denis MF, Pignataros OP, Kobatake E, Lazarowski ER, Schwarzbaum PJ. Homeostasis of extracellular ATP in human erythrocytes. J Biol Chem. 2011;286: 38397–38407. 10.1074/jbc.M111.221713 - DOI - PMC - PubMed
    1. Bergfeld GR, Forrester T. Release of ATP from human erythrocytes in response to a brief period of hypoxia and hypercapnia. Cardiovasc Res. 1992;26: 40–7. Available: http://www.ncbi.nlm.nih.gov/pubmed/1325292 - PubMed
    1. González-Alonso J, Olsen DB, Saltin B. Erythrocyte and the regulation of human skeletal muscle blood flow and oxygen delivery: role of circulating ATP. Circ Res. 2002;91: 1046–55. Available: http://www.ncbi.nlm.nih.gov/pubmed/12456491 - PubMed
    1. Sprague RS, Bowles EA, Achilleus D, Ellsworth ML. Erythrocytes as controllers of perfusion distribution in the microvasculature of skeletal muscle. Acta Physiol (Oxf). 2011;202: 285–92. 10.1111/j.1748-1716.2010.02182.x - DOI - PMC - PubMed

Grants and funding

This work was supported by Grant PIP 112 20110100639, Consejo Nacional de Investigaciones Científicas y Técnicas (PJS); Grant 20020130100027BA, Universidad de Buenos Aires (PJS); and Grant PICT 2014-0327, Agencia Nacional de Promoción Científica y Técnica (PJS). The funders had no role in study design, data collection and analysis, decision to publish, or preparation of the manuscript.

LinkOut - more resources