. 2016 Aug;30(8):889-904.
doi: 10.1210/me.2016-1002. Epub 2016 Jun 29.

Mutations of Vasopressin Receptor 2 Including Novel L312S Have Differential Effects on Trafficking

Affiliations

Mutations of Vasopressin Receptor 2 Including Novel L312S Have Differential Effects on Trafficking

Anatoly Tiulpakov et al. Mol Endocrinol. 2016 Aug.

Abstract

Nephrogenic syndrome of inappropriate antidiuresis (NSIAD) is a genetic disease first described in 2 unrelated male infants with severe symptomatic hyponatremia. Despite undetectable arginine vasopressin levels, patients have inappropriately concentrated urine resulting in hyponatremia, hypoosmolality, and natriuresis. Here, we describe and functionally characterize a novel vasopressin type 2 receptor (V2R) gain-of-function mutation. An L312S substitution in the seventh transmembrane domain was identified in a boy presenting with water-induced hyponatremic seizures at the age of 5.8 years. We show that, compared with wild-type V2R, the L312S mutation results in the constitutive production of cAMP, indicative of the gain-of-function NSIAD profile. Interestingly, like the previously described F229V and I130N NSIAD-causing mutants, this appears to both occur in the absence of notable constitutive β-arrestin2 recruitment and can be reduced by the inverse agonist Tolvaptan. In addition, to understand the effect of various V2R substitutions on the full receptor "life-cycle," we have used and further developed a bioluminescence resonance energy transfer intracellular localization assay using multiple localization markers validated with confocal microscopy. This allowed us to characterize differences in the constitutive and ligand-induced localization and trafficking profiles of the novel L312S mutation as well as for previously described V2R gain-of-function mutants (NSIAD; R137C and R137L), loss-of-function mutants (nephrogenic diabetes insipidus; R137H, R181C, and M311V), and a putative silent V266A V2R polymorphism. In doing so, we describe differences in trafficking between unique V2R substitutions, even at the same amino acid position, therefore highlighting the value of full and thorough characterization of receptor function beyond simple signaling pathway analysis.


Figures
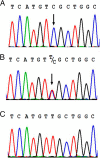
Figure 1.
Figure 1.
Electropherograms of DNA sequences of the AVPR2 gene. Hemizygous c.935T>C transition (exon 3) changing leucine (TTG) to serine (TCG) at position 312 (L312S) in the proband (A). Heterozygous L312S mutation in the mother (B). Wild-type sequence (C).
Figure 2.
Figure 2.
Effect of L312S mutation on AVP mediated G protein signaling. Concentration-response curves to AVP for cAMP (A) and IP1 (B) accumulation were generated using transiently transfected HEK293FT cells expressing either wild-type (black circles) or L312S (red squares) V2R tagged with Nluc. For cAMP accumulation (A), cells were stimulated with AVP (10fM–0.1μM) or forskolin (100μM) for 30 minutes in buffer containing IBMX (500μM). For IP1 accumulation (B), cells were stimulated with AVP (1pM–10μM) or carbachol (2mM) for 30 minutes in buffer containing LiCl (50mM). Cells were then lysed, and cAMP or IP1 accumulation was measured by HTRF. Data shown are normalized to the forskolin or carbachol response for cAMP and IP1 accumulation respectively and expressed as % of the wild-type V2R maximum response to observe constitutive activity. Points represent mean ± SEM of 4 independent experiments (A) and 6 independent experiments (B), and the curve fit is by nonlinear regression. The effect of 1μM inverse agonist Tolvaptan was also assessed (C) in terms of inhibiting constitutive (black and red bars) or ligand-induced (0.1nM AVP; white and blue bars) cAMP accumulation. Observations were made after 30 minutes in a buffer containing IBMX (500μM), in cells expressing either wild-type or L312S V2R tagged with Nluc. Data are expressed as a percentage of the wild-type response to 0.1nM AVP treatment.
Figure 3.
Figure 3.
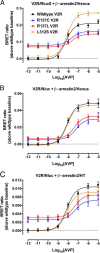
Effect of NSIAD V2R mutations on β-arrestin2 recruitment assessed with multiple BRET configurations. HEK293FT cells transiently transfected with cDNA coding for wild-type V2R (black circles), R137C V2R (blue triangles), R137L V2R (red squares), or L312S V2R (orange diamonds) C-terminally tagged with Rluc8 (A) or Nluc (B and C) and β-arrestin2/Venus (A and B) or β-arrestin2/HT (C) were used to determine concentration-response curves with AVP (1pM–10μM) for β-arrestin2 recruitment to wild-type or mutant V2Rs after about 30 minutes. Data are expressed as BRET ratio (above wild-type baseline) as described in Materials and Methods, and the associated kinetic data are shown in Supplemental Figure 1. Data represent mean ± SEM of 5 independent experiments, with curves fitted by nonlinear regression (GraphPad Prism).
Figure 4.
Figure 4.
Confocal microscopy validation of Venus/K-ras localization and demonstration of utility to assess V2R internalization. FLAG-tagged wild-type V2R (red) and Venus/K-ras (green) are colocalized on the plasma membrane (yellow) in the absence of agonist. Treatment with AVP for 15 minutes results in V2R internalization, whereas the distribution of Venus/K-ras is unchanged. Insets highlight white boxes. Nuclei are depicted in blue (Hoechst 33256). Scale bar, 10 μm.
Figure 5.
Figure 5.
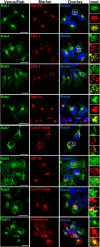
Confocal microscopy validation of Venus/Rab localization. Venus/Rab1, Venus/Rab4, Venus/Rab5, Venus/Rab6, Venus/Rab7, Venus/Rab8, Venus/Rab9, or Venus/Rab11 (green) was imaged with a relevant well-established marker as indicated (red) enabling insights to be obtained regarding subcellular localization (GM130 for cis-Golgi; EEA-1 for early endosomes; LysoTracker for late endosomes/lysosomes; transferrin for recycling endosomes). Representative images from serial confocal z-sections are depicted, with colocalization between Venus/Rabs and markers (yellow) evident upon overlay of individual fluorescence channels. Insets highlight magnifications of boxed regions. Nuclei were visualized with Hoechst 33256 stain (blue). Scale bar, 10 μm.
Figure 6.
Figure 6.
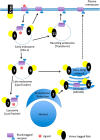
A simplified schematic representation of subcellular marker localization and receptor trafficking. Ligand-induced trafficking as well as constitutive localization was monitored using Rluc8-tagged wild-type or mutant V2R by measuring proximity via eBRET with the plasma membrane marker Venus/K-ras, or the subcellular compartment markers Rabs: Venus/Rab5a (5) for early endosomes; Venus/Rab4 (4) for early endosome recycling; Venus/Rab11 (11) for recycling endosomes; Venus/Rab7a (7) for late endosomes/lysosomes; Venus/Rab9 (9) for late endosome trafficking to the trans-Golgi network; Venus/Rab1 (1) for endoplasmic reticulum trafficking to the cis-Golgi; Venus/Rab6 (6) for Golgi apparatus and trans-Golgi network; or Venus/Rab8 (8) for trans-Golgi network to plasma membrane. The subcellular markers used for the confocal microscopy validation are also included for comparison.
Figure 7.
Figure 7.
Profiling the constitutive localization of (A) gain and (B) loss-of-function V2R mutants. HEK293FT cells were transiently transfected with wild-type or mutant V2R/Rluc8 with or without the plasma membrane marker Venus/K-ras or Venus/Rab intracellular markers. Constitutive localization is plotted relative to wild-type V2R (black circles and line = 1) calculated as described in Materials and Methods. Values more than 1 indicate increased relative basal localization, and values less than 1 indicate reduced relative basal localization. A, NSIAD V2R mutations R137C (blue triangles and line), R137L (red squares and line), and L312S (yellow diamonds and broken line) relative to wild-type V2R (black circles and line). B, NDI V2R mutations R137H (blue triangles and line), R181C (red squares and line), and M311V (yellow diamonds and broken line) relative to wild-type V2R (black circles and line). Points represent the mean of 3 independent experiments. Note the same wild-type data were used in the generation of A and B as well as Supplemental Figure 2.
Figure 8.
Figure 8.
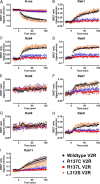
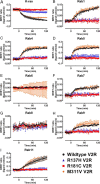
Kinetic profiling of the trafficking properties of gain-of-function V2R NSIAD mutants. HEK293FT cells were transiently transfected with wild-type V2R (black circles), R137C V2R (blue triangles), R137L V2R (red squares), or L312S V2R (orange diamonds) tagged with Rluc8 and (A) the plasma membrane marker K-ras or one of the subcellular markers (B) Rab1, (C) Rab4, (D) Rab5, (E) Rab6, (F) Rab7, (G) Rab8, (H) Rab9, or (I) Rab11 tagged with Venus. BRET ratio (ligand-vehicle) was calculated as described in Materials and Methods. AVP (1μM) or vehicle was added at t = 0 after establishment of the baseline. Points represent mean ± SEM of 3 independent experiments. Note wild-type data are replicated in Figure 9 and Supplemental Figure 4.
Figure 9.
Figure 9.
Kinetic profiling of the trafficking properties of loss-of-function V2R NDI mutants. HEK293FT cells were transiently transfected with wild-type V2R (black circles), R137H V2R (blue triangles), R181C V2R (red squares), or M311V V2R (orange diamonds) tagged with Rluc8 and (A) the plasma membrane marker K-ras or one of the subcellular markers (B) Rab1, (C) Rab4, (D) Rab5, (E) Rab6, (F) Rab7, (G) Rab8, (H) Rab9, or (I) Rab11 tagged with Venus. BRET ratio (ligand-vehicle) was calculated as described in Materials and Methods. AVP (1μM) or vehicle was added at t = 0 after establishment of the baseline. Points represent mean ± SEM of 3 independent experiments. Note wild-type data are replicated in Figure 8 and Supplemental Figure 4.
Figure 10.
Figure 10.
Schematic representation of the vasopressin receptor 2 amino acid sequence. The single amino acid changes under investigation in this study are highlighted, including NSIAD-causing R137C, R137L and L312S, NDI-causing R137H, R181C, and M311V and the putative polymorphism V266A. Note, this figure is purely illustrative and structural details should not be inferred. Actual boundaries between transmembrane helices and loops are likely to differ from that shown here.

Similar articles

Cited by

References

    1. Ball SG. Vasopressin and disorders of water balance: the physiology and pathophysiology of vasopressin. Ann Clin Biochem. 2007;44(pt 5):417–431. - PubMed
    1. Morello JP, Bichet DG. Nephrogenic diabetes insipidus. Annu Rev Physiol. 2001;63:607–630. - PubMed
    1. Birnbaumer M, Seibold A, Gilbert S, et al. Molecular cloning of the receptor for human antidiuretic hormone. Nature. 1992;357(6376):333–335. - PubMed
    1. Seibold A, Brabet P, Rosenthal W, Birnbaumer M. Structure and chromosomal localization of the human antidiuretic hormone receptor gene. Am J Hum Genet. 1992;51(5):1078–1083. - PMC - PubMed
    1. Stenson PD, Mort M, Ball EV, Shaw K, Phillips A, Cooper DN. The human gene mutation database: building a comprehensive mutation repository for clinical and molecular genetics, diagnostic testing and personalized genomic medicine. Hum Genet. 2014;133(1):1–9. - PMC - PubMed