. 2017 Jan 19;36(3):397-409.
doi: 10.1038/onc.2016.211. Epub 2016 Jun 27.

Mitochondrial stress-induced p53 attenuates HIF-1α activity by physical association and enhanced ubiquitination

Affiliations

Mitochondrial stress-induced p53 attenuates HIF-1α activity by physical association and enhanced ubiquitination

A Roy Chowdhury et al. Oncogene. .

Abstract

Retrograde signaling is a mechanism by which mitochondrial dysfunction is communicated to the nucleus for inducing a metabolic shift essential for cell survival. Previously, we showed that partial mitochondrial DNA (mtDNA) depletion in different cell types induced mitochondrial retrograde signaling pathway (MtRS) involving Ca+2-sensitive Calcineurin (Cn) activation as an immediate upstream event of stress response. In multiple cell types, this stress signaling was shown to induce tumorigenic phenotypes in immortalized cells. In this study we show that MtRS also induces p53 expression, which was abrogated by Ca2+ chelators and short hairpin RNA-mediated knockdown of CnAβ mRNA. Mitochondrial dysfunction induced by mitochondrial ionophore, carbonyl cyanide m-chlorophenyl hydrazone and other respiratory inhibitors, which perturb the transmembrane potential, were equally efficient in inducing the expression of p53 and downregulation of MDM2. Stress-induced p53 physically interacted with hypoxia-inducible factor-1α (HIF-1α) and attenuated the latter's binding to promoter DNA motifs. In addition, p53 promoted ubiquitination and degradation of HIF-1α in partial mtDNA-depleted cells. The mtDNA depleted cells, with inhibited HIF-1α, showed upregulation of glycolytic pathway genes, glucose transporter 1-4 (Glut1-4), phosphoglycerate kinase 1 and Glucokinase but not of prolyl hydroxylase isoforms. For the first time we show that p53 is induced as part of MtRS and it renders HIF-1α inactive by physical interaction. In this respect, our results show that MtRS induces tumor growth independent of the HIF-1α pathway.


Conflict of interest statement

The authors declare no conflict of the interest.

Figures
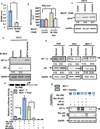
Figure 1
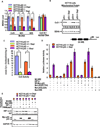
Figure 1. Effects of partial depletion of mtDNA on the HIF-1α and p53 protein levels in different cell lines
(A) Relative mt-DNA content in control and ddC treated C2C12 cells was measured by q-PCR of total cell DNA using primers specific for the cytochrome oxidase subunit I gene (CcOI). GAPDH and nuclear encoded CcOIVi1 gene were used as internal controls. The values represent mean ±SEAM of four independent assays. P<0.005 (‘**’). (B) The level of ROS in control and mtDNA depleted C2C12 cells were measure by DCF fluorescence method. Mito-CP (10 nM) was added at the start of the measurement. Values represent average of triplicates. Where *, p< 0.05. (C) Immunoblot analysis of cell extracts (50 µg each) for IGF1R and GAPDH as loading control. (D) Immunoblot for HIF-1α and p53 levels in control and mtDNA depleted C2C12 cells using total lysates (40µg protein). Protein extract from C2C12 cells transfected with HIF-1α was used as a positive control. The blot was also probed with GAPDH antibody as loading control. Values in parentheses indicate relative band intensities. (E), Immunoblot analysis of protein extracts (40µg each) of control and mtDNA depleted A549, H9c2, and MCF7 cells. Values in parentheses indicate relative band intensities normalized with GAPDH expression. Iimmunoblots were also probed with GAPDH as a loading control. (F) HRE promoter-reporter assay in control and mtDNA depleted MCF7 cells. A trimeric HRE promoter-reporter DNA construct or a mutant version was transfected. Cells were also cotransfected with Renilla luciferase, with or without pCEP4–HIF-1α or pCDNA-Myc-wtp53 as indicated in figure. After 48hrs dual luciferase activity were measured and the data were normalized to Renila luciferase activity and represent the mean ± S.E. of 3 independent assays. (G) Immunoblot analysis of cellular extracts (50 µg protein each) of control and various transfected cells from figure F was used to ensure protein expression. Antibody to GAPDH was used to assess loading levels.
Figure 2
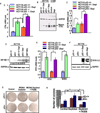
Figure 2. Retrograde response of p53 and HIF-1α in HCT colon cancer cells
(A) Mt-DNA contents were measured by qPCR anlysis in control and depleted human colon adenocarcinoma cell lines (HCT116) differing only in their p53 status. Use of the paired Student’s t-test indicated that all mentioned genes were inhibited in mt-DNA depleted cells with a confidence level of P<0.005 (‘**’). (B) Immunoblot analysis of control and mtDNA depleted HCT116 p53+/+ and p53−/− cells using CcOI antibody. The blot was also probed with SDHA antibody for assessing loading levels. (C) The CcO activity was measured with 20µg of freeze-thawed mitochondria as described in the Materials and Methods section. Means ± S.E. were calculated from 3 independent assays. ** indicates p<0.005. (D) HRE promoter-reporter assay in mt DNA depleted p53+/+ and p53−/− HCT116 cells. A trimeric HRE promoter-reporter DNA construct or a mutant version was transfected. Cells were also cotransfected with Renilla luciferase, with or without pCEP4-HIF-1α or pCDNA-Myc-wtp53 or Mut-p53 (R175H, L22A) as indicated. After 48hrs cell extracts were assayed for dual luciferase activity. The data were normalized to Renila luciferase activity and represent the mean ± S.E. of 3 independent assays. (E) Represents an immunoblot of cell extracts from Fig. D for assessing HIF-1α and p53 contents. The blot was also probed with GAPDH antibody for assessing loading levels.
Figure 3
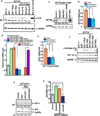
Figure 3. Activation of Retrograde signaling markers in p53+/+ and p53−/− cells
(A) Shows the induction of cathepsin L (CTSL) mRNA, (B) CTSL protein; (C) shows the increase of IGFR1 mRNA and (D) IGF1R protein. (E) Shows the mRNA levels of Ryanodine receptor 1 and 3 in indicated cell lines and (F) shows protein levels. Values in parentheses indicate relative band intensities normalized with relative GAPDH levels. (G) Anchorage-independent growth of control and mtDNA depleted p53+/+ and p53−/− cells were analyzed by soft agar colony formation assay as described in Materials and methods. Both sets of mtDNA depleted cells were treated with or without FK506, an inhibitor calcineurin after 3 weeks of growth are shown. (H) The histograms show the average number of colonies of three different plates. Means ± S.E. were calculated from 3 independent assays. ** indicates p<0.005 and *, p< 0.05
Figure 4
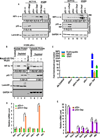
Figure 4. Increased CnAβ protein and mRNA levels in Mt-DNA depleted cells
(A) Represents the immunoblot analysis of control and mt-DNA depleted HCT116 p53+/+ and p53−/− cells stably expressing shRNA against CnAβ mRNA or scrambled shRNA (Scram 1 and 2). Rat brain protein extract was used as a positive control. (B) CnAβ mRNA level was measured by qPCR. Values represent average of three estimates that were normalized to GAPDH as an internal control. (C) Immunoblot analysis of cell extracts with antibody to IGF1R β. (D) mRNA levels of IGF1R measured by qPCR in mtDNA depleted cells expressing Scrambled and shRNA against CnAβ. (E) RyR1 mRNA levels measured as in Fig D. Values in D and E represent average of triplicates and normalized against GAPDH mRNA level as an internal control. (F) shows the immunoblot analysis of cell extracts using Akt1/2 and Phos-AKT antibodies. (G) Represents the immunoblot analysis of HIF-1α and p53 in HCT116 cells transfected with various shRNA constructs. The blots in A, C, F and G were reprobed with GAPDH antibody as loading controls. (H) p53 mRNA level was measured by qPCR analysis among the indicated cell lines. Means ± S.E. were calculated from 3 independent assays. ** indicates p<0.005 and *, p< 0.05. Values in parentheses of all immunoblots indicate relative band intensities normalized with GAPDH band intensities.
Figure 5
Figure 5. Mitochondrial stress-induced HIF-1α activation in p53+/+ and p53−/− HCT116 cells
(A) Immunoblot analysis of nuclear and cytosolic fractions with antibodies to HIF-1α and p53 in indicated cells. (B) The effects of ectopically expressed WT and R175H mutant p53 in H1299 prostate cancer cells which lack p53 expression. Details were as in Fig. 2D. Antibody to Laminin B1 used as a nuclear marker and antibody to GAPDH was used as cytoplasmic marker. The numbers in parentheses in A and B represent band intensities (average of two separate estimates). (C) ChIP analysis of EPO, VEGF and Glut-1 promoter regions for HIF-1α binding. Data represent Means ± S.E of three independent assay points. (D and E) mRNA levels for different glycolytic pathway genes in control and depleted p53+/+ and p53−/− cells (Fig. E) by realtime PCR. Means ± S.E. were calculated from 3 independent assays. ** indicates p<0.005 and *, p< 0.05. Values in parentheses of all immunoblots (average of two separate estimates) indicate relative band intensities normalized with relative GAPDH levels.
Figure 6
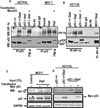
Figure 6. HIF-1α directly associates with p53
(A) Total lysates of indicated cells (1 mg each) were immunoprecipitated (IP) by anti-p53 antibody (goat) or anti-Myc antibody and immunoblotted with anti-HIF-1α and anti-p53 antibody (mouse) as indicated. Lysates without antibody and goat IgG were used as a negative and positive controls, respectively. (B) Association of p53 and HIF-1α proteins were further confirmed by immunoprecipitation with antibody against HIF-1α and immunobloted with indicated antibodies. Rabbit IgG and lysates with no antibody were used as controls. (C–D) 3% input of total cell lysates of indicated cell lines were subject to immunoblot using HIF-1α, p53 and GAPDH antibodies as indicated.
Figure 7
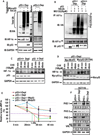
Figure 7. p53 mediated poly-ubiquitination of HIF-1α and its turnover
(A–B) depleted HCT116 p53−/− and p53+/+ cells were transiently transfected with indicated expression plasmids. Cells were harvested at 36h after transfections, and total protein was immunoprecipitated (IP) with HIF-1α antibody and immunoblotted with anti-HA to evaluate the level of ubiquitination. The blots were also reprobed with HIF-1α and p53 antibodies. (C–E) Rates of turnover of HIF-1α in p53+/+ and p53−/− cells. Cells were incubated with 100µM cyclohexamide (CHX) to suppress the synthesis of new protein. The cell lysates (40 µg each) at indicated time were subjected to immunoblot analysis with p53 antibody. In (D) cells were transfected with either WT or R175H mutant p53 in HCT116 p53−/− cells. The relative p53 band intensities were calculated using the intensity of zero time of exposure with CHX as 100 percent. Means and standard deviations were calculated from three independent experiments. (F) Total cell lysates (40 µg protein each) of indicated cell line were subjected to immunoblot analysis with antibodies against PHD1, PHD2, PHD3 and VHL antibody. GAPDH was used for the loading control. The values in parentheses indicate relative band intensities normalized to relative levels of GAPDH protein.

Similar articles

Cited by

References

    1. Amundson SA, Myers TG, Fornace AJ., Jr Roles for p53 in growth arrest and apoptosis: putting on the brakes after genotoxic stress. Oncogene. 1998;17:3287–3299. - PubMed
    1. Sun Y, Wicha M, Leopold WR. Regulation of metastasis-related gene expression by p53: a potential clinical implication. Mol Carcinog. 1999;24:25–28. - PubMed
    1. Menendez D, Inga A, Snipe J, Krysiak O, Schonfelder G, Resnick MA. A single-nucleotide polymorphism in a half-binding site creates p53 and estrogen receptor control of vascular endothelial growth factor receptor 1. Mol Cell Biol. 2007;27:2590–2600. - PMC - PubMed
    1. Roger L, Jullien L, Gire V, Roux P. Gain of oncogenic function of p53 mutants regulates E-cadherin expression uncoupled from cell invasion in colon cancer cells. J Cell Sci. 2010;123:1295–1305. - PubMed
    1. Liu G, Chen X. Regulation of the p53 transcriptional activity. J Cell Biochem. 2006;97:448–458. - PubMed

Publication types