Modeling the spread of polio in an IPV-vaccinated population: lessons learned from the 2013 silent outbreak in southern Israel
- PMID: 27334457
- PMCID: PMC4918056
- DOI: 10.1186/s12916-016-0637-z
Modeling the spread of polio in an IPV-vaccinated population: lessons learned from the 2013 silent outbreak in southern Israel
Erratum in
-
Erratum to: Modeling the spread of polio in an IPV-vaccinated population: lessons learned from the 2013 silent outbreak in southern Israel.BMC Med. 2016 Aug 19;14(1):120. doi: 10.1186/s12916-016-0666-7. BMC Med. 2016. PMID: 27538466 Free PMC article. No abstract available.
Abstract
Background: Polio eradication is an extraordinary globally coordinated health program in terms of its magnitude and reach, leading to the elimination of wild poliovirus (WPV) in most parts of the world. In 2013, a silent outbreak of WPV was detected in Israel, a country using an inactivated polio vaccine (IPV) exclusively since 2005. The outbreak was detected using environmental surveillance (ES) of sewage reservoirs. Stool surveys indicated the outbreak to be restricted mainly to children under the age of 10 in the Bedouin population of southern Israel. In order to curtail the outbreak, a nationwide vaccination campaign using oral polio vaccine (OPV) was conducted, targeting all children under 10.
Methods: A transmission model, fitted to the results of the stool surveys, with additional conditions set by the ES measurements, was used to evaluate the prevalence of WPV in Bedouin children and the effectiveness of the vaccination campaign. Employing the parameter estimates of the model fitting, the model was used to investigate the effect of alternative timings, coverages and dosages of the OPV campaign on the outcome of the outbreak.
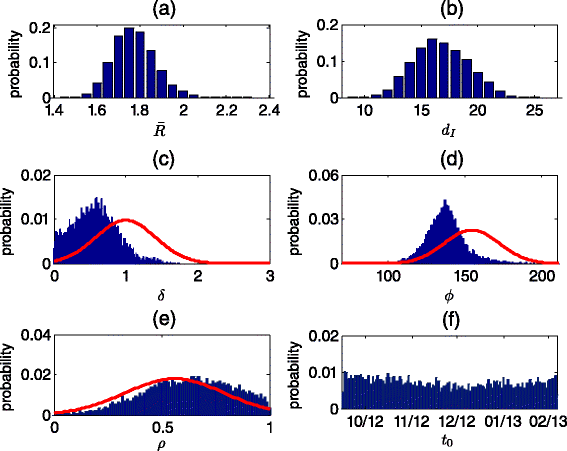
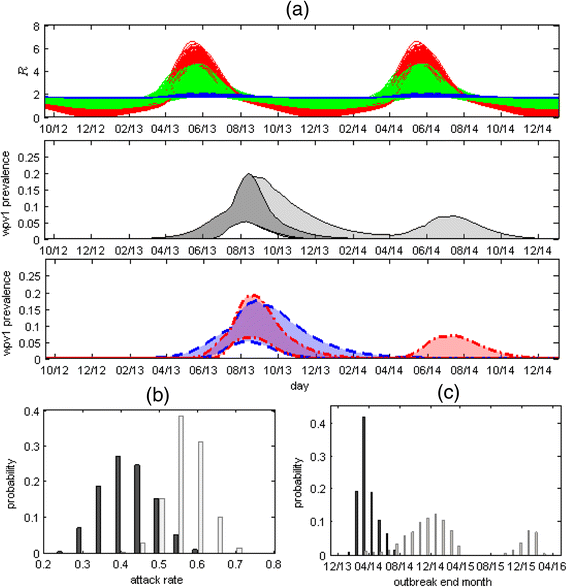
Results: The mean estimate for the mean reproductive number was 1.77 (95 % credible interval, 1.46-2.30). With seasonal variation, the reproductive number maximum range was between zero and six. The mean estimate for the mean infectious periods was 16.8 (8.6-24.9) days. The modeling indicates the OPV campaign was effective in curtailing the outbreak. The mean estimate for the attack rate in Bedouin children under 10 at the end of 2014 was 42 % (22-65 %), whereas without the campaign the mean projected attack rate was 57 % (35-74 %). The campaign also likely shortened the duration of the outbreak by a mean estimate of 309 (2-846) days. A faster initiation of the OPV campaign could have reduced the incidence of WPV even if a lower coverage was reached, at the risk of prolonging the outbreak.
Conclusions: OPV campaigns are essential for interrupting WPV transmission, even in a developed country setting with a high coverage of IPV. In this setting, establishing ES of WPV circulation is particularly crucial for early detection and containment of an outbreak.
Keywords: Inactivated polio vaccine; Model fitting; Oral polio vaccine; Polio; Transmission model; Vaccination strategies.
Figures


Similar articles
-
Trade-offs of different poliovirus vaccine options for outbreak response in the United States and other countries that only use inactivated poliovirus vaccine (IPV) in routine immunization.Vaccine. 2024 Feb 6;42(4):819-827. doi: 10.1016/j.vaccine.2023.12.081. Epub 2024 Jan 12. Vaccine. 2024. PMID: 38218668 Free PMC article. Review.
-
Assessing the stability of polio eradication after the withdrawal of oral polio vaccine.PLoS Biol. 2018 Apr 27;16(4):e2002468. doi: 10.1371/journal.pbio.2002468. eCollection 2018 Apr. PLoS Biol. 2018. PMID: 29702638 Free PMC article.
-
Modeling options to manage type 1 wild poliovirus imported into Israel in 2013.J Infect Dis. 2015 Jun 1;211(11):1800-12. doi: 10.1093/infdis/jiu674. Epub 2014 Dec 10. J Infect Dis. 2015. PMID: 25505296 Free PMC article.
-
Cessation of Trivalent Oral Poliovirus Vaccine and Introduction of Inactivated Poliovirus Vaccine - Worldwide, 2016.MMWR Morb Mortal Wkly Rep. 2016 Sep 9;65(35):934-8. doi: 10.15585/mmwr.mm6535a3. MMWR Morb Mortal Wkly Rep. 2016. PMID: 27606675
-
Intestinal mucosal immunity is unimportant for polio eradication: the failure of oral polio vaccination.Infect Dis (Lond). 2024 Aug;56(8):669-677. doi: 10.1080/23744235.2024.2367742. Epub 2024 Jun 18. Infect Dis (Lond). 2024. PMID: 38889538 Review.
Cited by
-
Population Immunity and Polio Eradication.Pathogens. 2024 Feb 20;13(3):183. doi: 10.3390/pathogens13030183. Pathogens. 2024. PMID: 38535527 Free PMC article. Review.
-
Trade-offs of different poliovirus vaccine options for outbreak response in the United States and other countries that only use inactivated poliovirus vaccine (IPV) in routine immunization.Vaccine. 2024 Feb 6;42(4):819-827. doi: 10.1016/j.vaccine.2023.12.081. Epub 2024 Jan 12. Vaccine. 2024. PMID: 38218668 Free PMC article. Review.
-
The role of time-varying viral shedding in modelling environmental surveillance for public health: revisiting the 2013 poliovirus outbreak in Israel.J R Soc Interface. 2022 May;19(190):20220006. doi: 10.1098/rsif.2022.0006. Epub 2022 May 18. J R Soc Interface. 2022. PMID: 35582812 Free PMC article.
-
Multiscale model for forecasting Sabin 2 vaccine virus household and community transmission.PLoS Comput Biol. 2021 Dec 21;17(12):e1009690. doi: 10.1371/journal.pcbi.1009690. eCollection 2021 Dec. PLoS Comput Biol. 2021. PMID: 34932560 Free PMC article.
-
Inferring Numbers of Wild Poliovirus Excretors Using Quantitative Environmental Surveillance.Vaccines (Basel). 2021 Aug 6;9(8):870. doi: 10.3390/vaccines9080870. Vaccines (Basel). 2021. PMID: 34451995 Free PMC article.
References
-
- IMB. Independent Monitoring Board of the Global Polio Eradication Initiative - Twelfth Report. 2015.
MeSH terms
Substances
LinkOut - more resources
Full Text Sources
Other Literature Sources
Medical

