

Deregulation of polycomb repressor complex 1 modifier AUTS2 in T-cell leukemia
- PMID: 27322685
- PMCID: PMC5216730
- DOI: 10.18632/oncotarget.9982
Deregulation of polycomb repressor complex 1 modifier AUTS2 in T-cell leukemia
Abstract
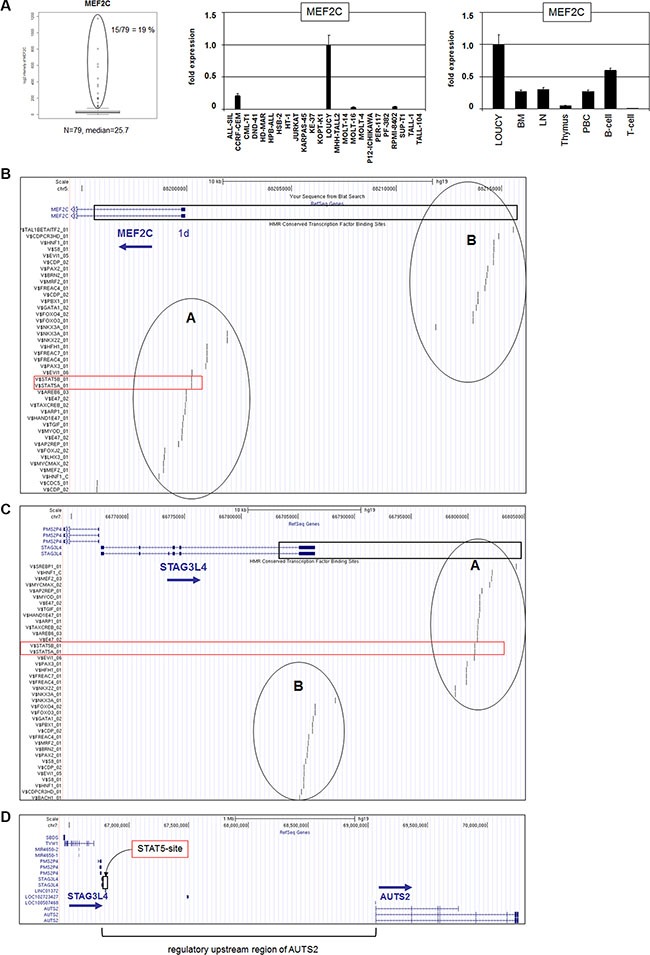
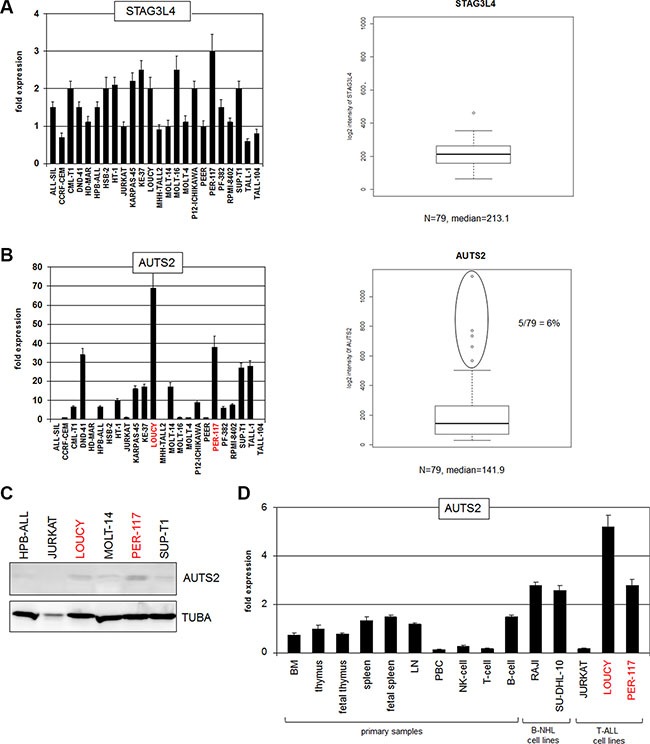
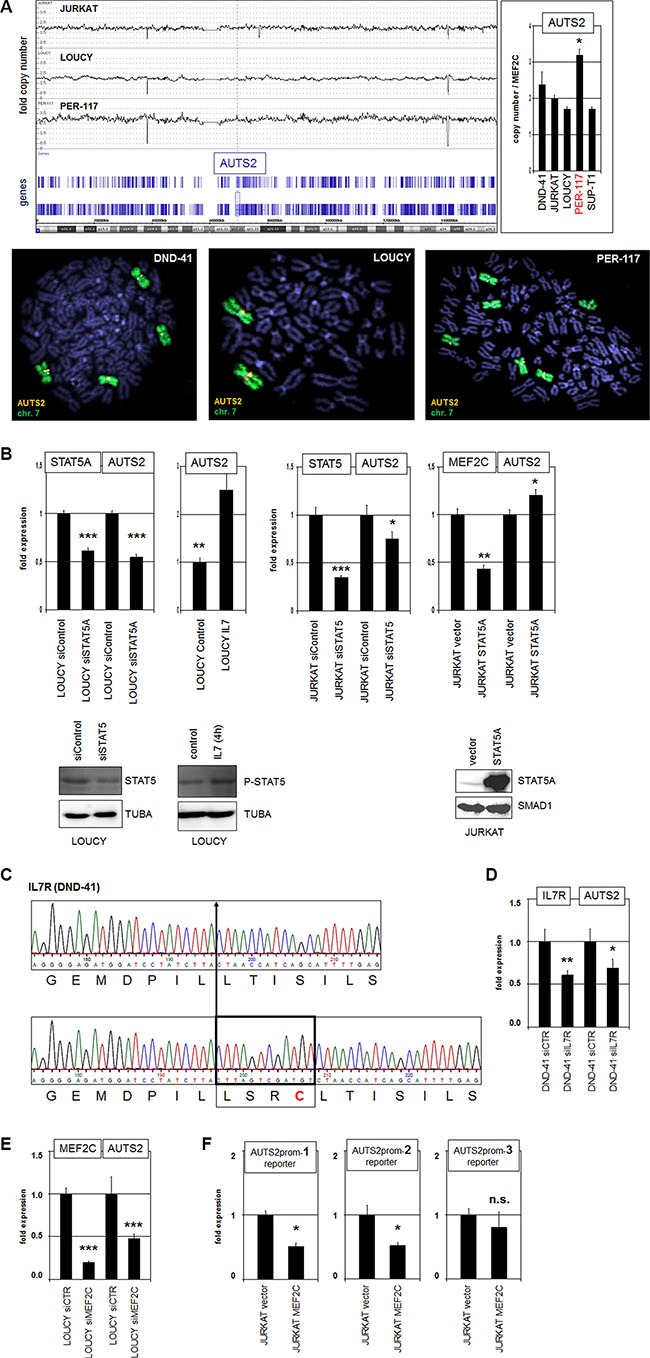
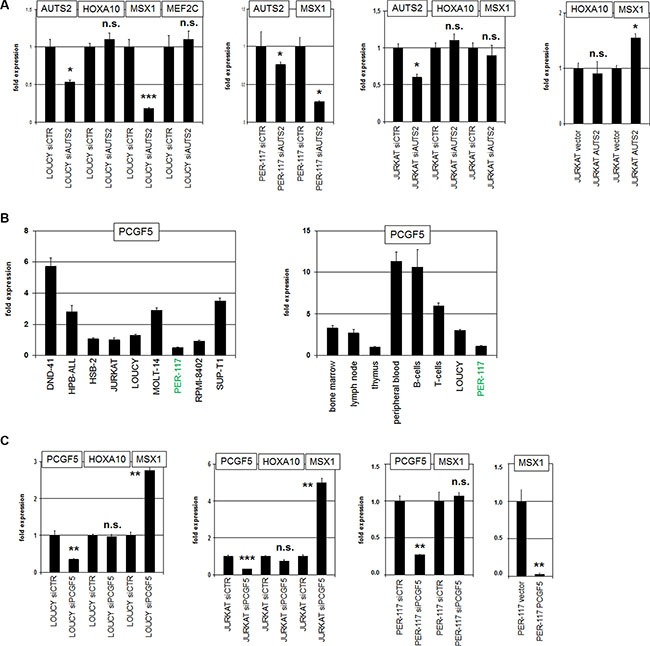
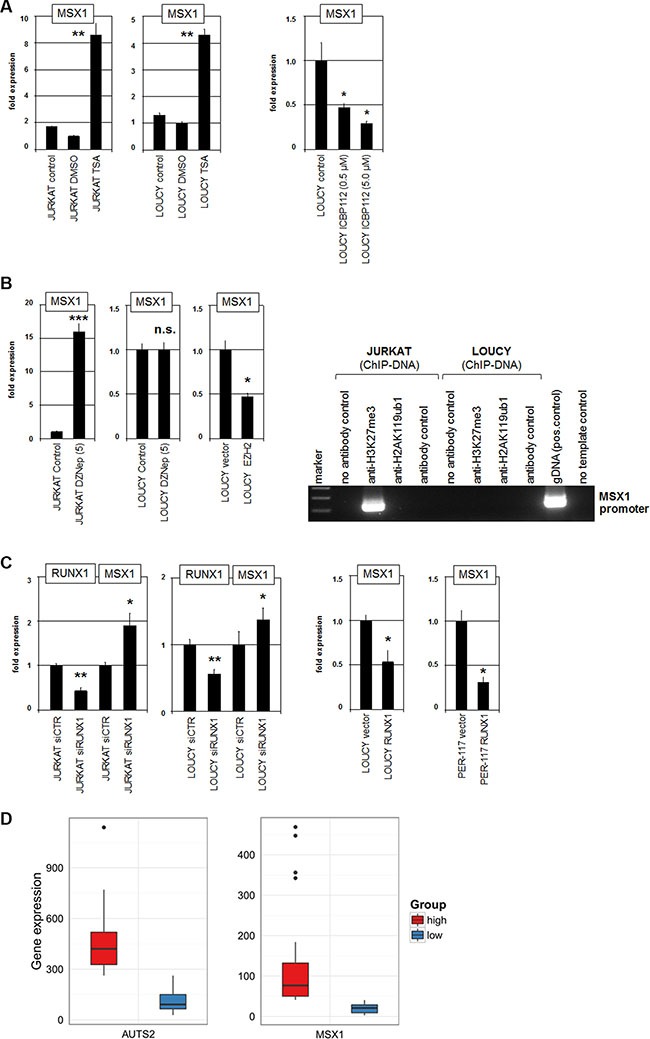
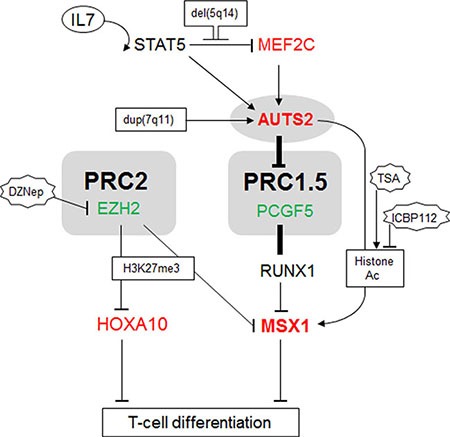
Recently, we identified deregulated expression of the B-cell specific transcription factor MEF2C in T-cell acute lymphoid leukemia (T-ALL). Here, we performed sequence analysis of a regulatory upstream section of MEF2C in T-ALL cell lines which, however, proved devoid of mutations. Unexpectedly, we found strong conservation between the regulatory upstream region of MEF2C (located at chromosomal band 5q14) and an intergenic stretch at 7q11 located between STAG3L4 and AUTS2, covering nearly 20 kb. While the non-coding gene STAG3L4 was inconspicuously expressed, AUTS2 was aberrantly upregulated in 6% of T-ALL patients (public dataset GSE42038) and in 3/24 T-ALL cell lines, two of which represented very immature differentiation stages. AUTS2 expression was higher in normal B-cells than in T-cells, indicating lineage-specific activity in lymphopoiesis. While excluding chromosomal aberrations, examinations of AUTS2 transcriptional regulation in T-ALL cells revealed activation by IL7-IL7R-STAT5-signalling and MEF2C. AUTS2 protein has been shown to interact with polycomb repressor complex 1 subtype 5 (PRC1.5), transforming this particular complex into an activator. Accordingly, expression profiling and functional analyses demonstrated that AUTS2 activated while PCGF5 repressed transcription of NKL homeobox gene MSX1 in T-ALL cells. Forced expression and pharmacological inhibition of EZH2 in addition to H3K27me3 analysis indicated that PRC2 repressed MSX1 as well. Taken together, we found that AUTS2 and MEF2C, despite lying on different chromosomes, share strikingly similar regulatory upstream regions and aberrant expression in T-ALL subsets. Our data implicate chromatin complexes PRC1/AUTS2 and PRC2 in a gene network in T-ALL regulating early lymphoid differentiation.
Keywords: IL-7; IL7R; MEF2C; PRC1; PRC2.
Conflict of interest statement
The authors declare they have no known conflicts of interest in this work.
Figures
Similar articles
-
Depressing time: Waiting, melancholia, and the psychoanalytic practice of care.In: Kirtsoglou E, Simpson B, editors. The Time of Anthropology: Studies of Contemporary Chronopolitics. Abingdon: Routledge; 2020. Chapter 5. In: Kirtsoglou E, Simpson B, editors. The Time of Anthropology: Studies of Contemporary Chronopolitics. Abingdon: Routledge; 2020. Chapter 5. PMID: 36137063 Free Books & Documents. Review.
-
Impact of residual disease as a prognostic factor for survival in women with advanced epithelial ovarian cancer after primary surgery.Cochrane Database Syst Rev. 2022 Sep 26;9(9):CD015048. doi: 10.1002/14651858.CD015048.pub2. Cochrane Database Syst Rev. 2022. PMID: 36161421 Free PMC article. Review.
-
Interventions to increase patient and family involvement in escalation of care for acute life-threatening illness in community health and hospital settings.Cochrane Database Syst Rev. 2020 Dec 8;12(12):CD012829. doi: 10.1002/14651858.CD012829.pub2. Cochrane Database Syst Rev. 2020. PMID: 33285618 Free PMC article.
-
Dynamic Field Theory of Executive Function: Identifying Early Neurocognitive Markers.Monogr Soc Res Child Dev. 2024 Dec;89(3):7-109. doi: 10.1111/mono.12478. Monogr Soc Res Child Dev. 2024. PMID: 39628288 Free PMC article.
-
Psychological therapies for people with borderline personality disorder.Cochrane Database Syst Rev. 2020 May 4;5(5):CD012955. doi: 10.1002/14651858.CD012955.pub2. Cochrane Database Syst Rev. 2020. PMID: 32368793 Free PMC article.
Cited by
-
PMF-GRN: a variational inference approach to single-cell gene regulatory network inference using probabilistic matrix factorization.Genome Biol. 2024 Apr 8;25(1):88. doi: 10.1186/s13059-024-03226-6. Genome Biol. 2024. PMID: 38589899 Free PMC article.
-
NKL homeobox gene activities in B-cell development and lymphomas.PLoS One. 2018 Oct 11;13(10):e0205537. doi: 10.1371/journal.pone.0205537. eCollection 2018. PLoS One. 2018. PMID: 30308041 Free PMC article.
-
The Role of NKL Homeobox Genes in T-Cell Malignancies.Biomedicines. 2021 Nov 12;9(11):1676. doi: 10.3390/biomedicines9111676. Biomedicines. 2021. PMID: 34829904 Free PMC article. Review.
-
Identification of Parkinson's disease-associated chromatin regulators.Sci Rep. 2023 Feb 22;13(1):3084. doi: 10.1038/s41598-023-30236-4. Sci Rep. 2023. PMID: 36813848 Free PMC article.
-
A new ETV6-NTRK3 cell line model reveals MALAT1 as a novel therapeutic target - a short report.Cell Oncol (Dordr). 2018 Feb;41(1):93-101. doi: 10.1007/s13402-017-0356-2. Epub 2017 Nov 8. Cell Oncol (Dordr). 2018. PMID: 29119387
References
-
- Ferrando AA, Look AT. Gene expression profiling in T-cell acute lymphoblastic leukemia. Semin Hematol. 2003;40:274–280. - PubMed
-
- Armstrong SA, Look AT. Molecular genetics of acute lymphoblastic leukemia. J Clin Oncol. 2005;23:6306–6315. - PubMed
-
- Peirs S, Van der Meulen J, Van de Walle I, Taghon T, Speleman F, Poppe B, Van Vlierberghe P. Epigenetics in T-cell acute lymphoblastic leukemia. Immunol Rev. 2015;263:50–67. - PubMed
-
- Hatano M, Roberts CW, Minden M, Crist WM, Korsmeyer SJ. Deregulation of a homeobox gene, HOX11, by the t(10; 14) in T cell leukemia. Science. 1991;253:79–82. - PubMed
MeSH terms
Substances
LinkOut - more resources
Full Text Sources
Other Literature Sources
Research Materials
Miscellaneous
