

The relationship between apoptosis, chromatin configuration, histone modification and competence of oocytes: A study using the mouse ovary-holding stress model
- PMID: 27321442
- PMCID: PMC4913248
- DOI: 10.1038/srep28347
The relationship between apoptosis, chromatin configuration, histone modification and competence of oocytes: A study using the mouse ovary-holding stress model
Abstract
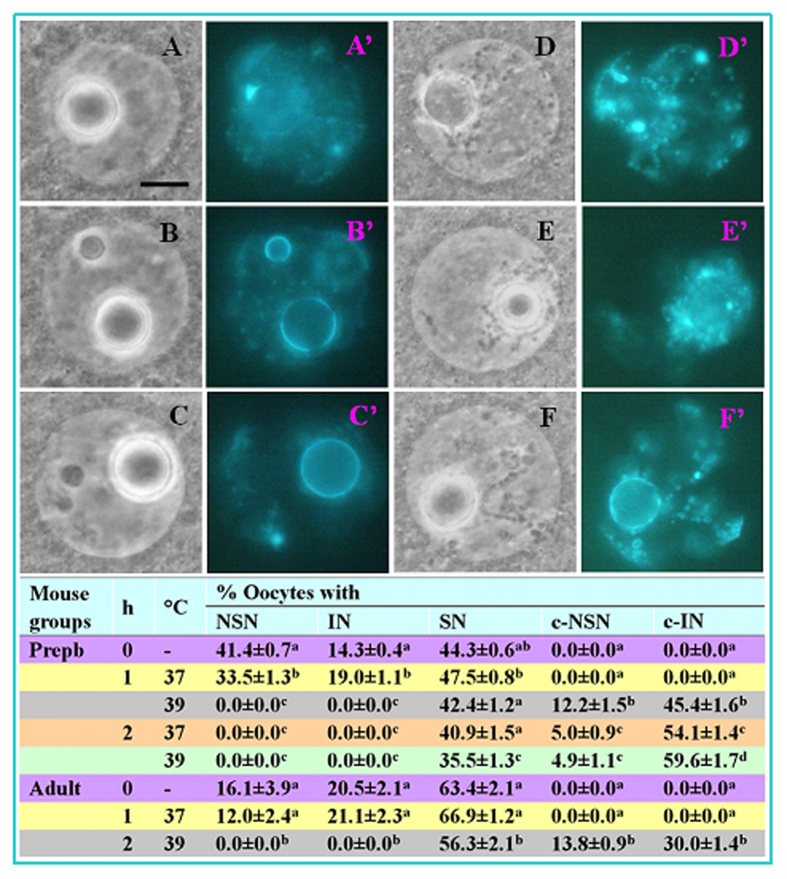
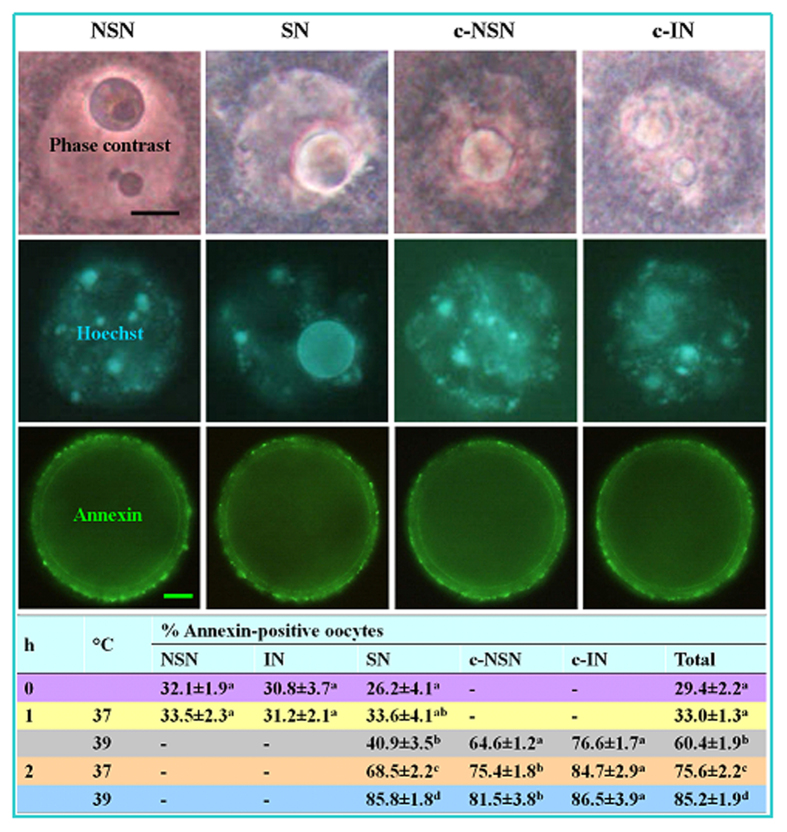
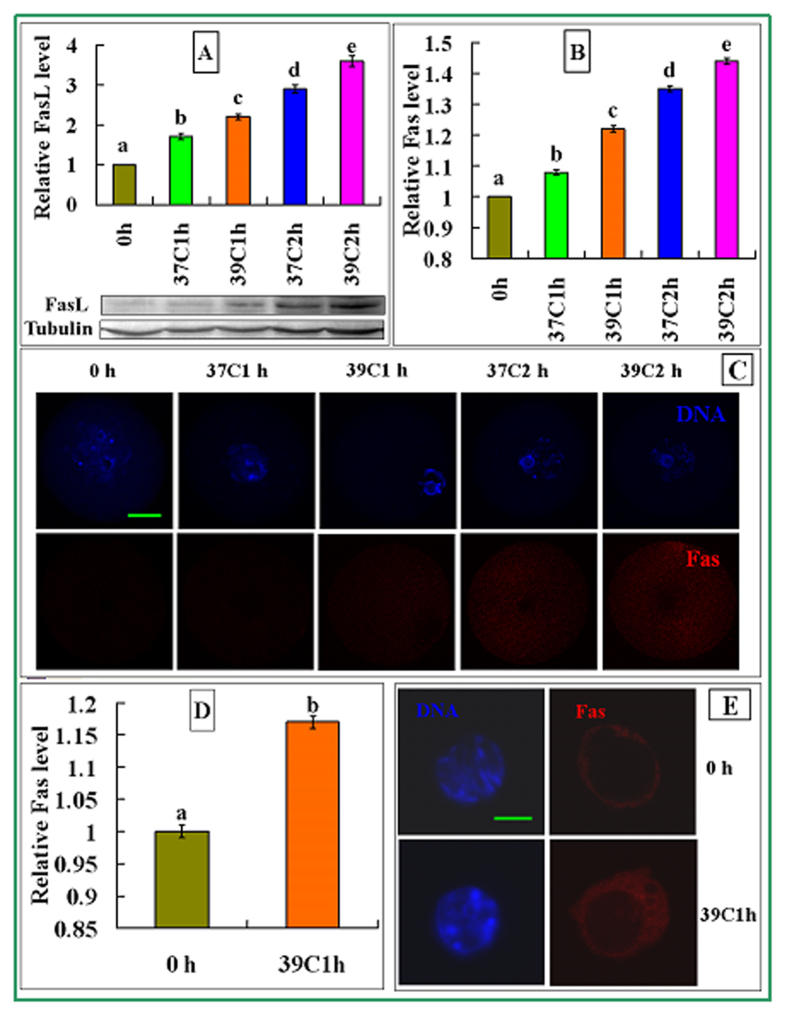
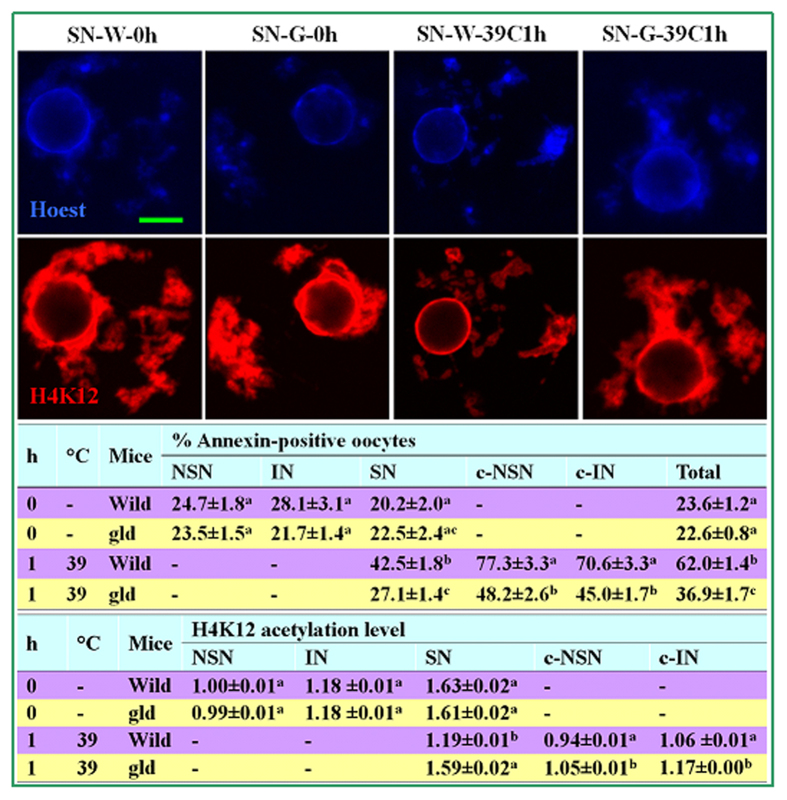
The epigenetic factors causing competence differences between SN (surrounded nucleolus) and NSN (non-surrounded nucleolus) oocytes, the significance for the increased histone acetylation and methylation in SN oocytes, and whether chromatin configuration or histone modification determines oocyte competence, are unclear. This study has addressed these issues by using the ovary-holding (OH) stress models where oocyte SN configuration was uncoupled from histone modifications and developmental potential. Prepubertal mouse ovaries containing high percentages of NSN oocytes were preserved at 37 or 39 °C for 1 or 2 h before examination for oocyte chromatin configuration, developmental competence, histone modification and apoptosis. Whereas 1-h OH at 37 °C caused a moderate apoptosis with increased oocyte competence, improved histone modification and a normal NSN-to-SN transition, harsher OH conditions induced a severe apoptosis with decreased oocyte competence, impaired histone modification and a pseudo (premature) NSN-to-SN transition. Observations on Fas/FasL expression and using the gld (generalized lymphoproliferative disorder) mice harboring FasL mutations indicated that OH triggered oocyte apoptosis with activation of the Fas signaling. It was concluded that OH stress caused oocyte apoptosis with activation of the Fas/FasL system and that oocyte competence was more closely correlated with histone modification than with chromatin configuration.
Figures


Similar articles
-
Restraint stress on female mice diminishes the developmental potential of oocytes: roles of chromatin configuration and histone modification in germinal vesicle stage oocytes.Biol Reprod. 2015 Jan;92(1):13. doi: 10.1095/biolreprod.114.124396. Epub 2014 Nov 19. Biol Reprod. 2015. PMID: 25411393
-
Effect of ovary holding temperature and time on equine granulosa cell apoptosis, oocyte chromatin configuration and cumulus morphology.Theriogenology. 2004 Aug;62(3-4):468-80. doi: 10.1016/j.theriogenology.2003.10.006. Theriogenology. 2004. PMID: 15226003
-
Meiotic arrest with roscovitine and sexual maturity improve competence of mouse oocytes by regulating expression of competence-related genes.J Reprod Dev. 2021 Apr 21;67(2):115-122. doi: 10.1262/jrd.2020-142. Epub 2021 Feb 17. J Reprod Dev. 2021. PMID: 33597332 Free PMC article.
-
Chromatin configurations in the germinal vesicle of mammalian oocytes.Mol Hum Reprod. 2009 Jan;15(1):1-9. doi: 10.1093/molehr/gan069. Epub 2008 Nov 18. Mol Hum Reprod. 2009. PMID: 19019837 Review.
-
Chromatin Configuration in Diplotene Mouse and Human Oocytes during the Period of Transcriptional Activity Extinction.Int J Mol Sci. 2023 Jul 15;24(14):11517. doi: 10.3390/ijms241411517. Int J Mol Sci. 2023. PMID: 37511273 Free PMC article. Review.
Cited by
-
Mechanisms by which in vitro meiotic arrest and sexual maturity improve developmental potential of mouse oocytes.Sci Rep. 2017 Nov 17;7(1):15763. doi: 10.1038/s41598-017-16119-5. Sci Rep. 2017. PMID: 29150675 Free PMC article.
-
LSM1-mediated Major Satellite RNA decay is required for nonequilibrium histone H3.3 incorporation into parental pronuclei.Nat Commun. 2023 Feb 21;14(1):957. doi: 10.1038/s41467-023-36584-z. Nat Commun. 2023. PMID: 36810573 Free PMC article.
-
Xanthan gum and Locust bean gum gel supports in vitro development of porcine oocytes derived from early antral follicles.J Reprod Dev. 2019 Dec 18;65(6):551-554. doi: 10.1262/jrd.2019-074. Epub 2019 Oct 6. J Reprod Dev. 2019. PMID: 31588063 Free PMC article.
-
A transition phase in late mouse oogenesis impacts DNA methylation of the early embryo.Commun Biol. 2022 Oct 2;5(1):1047. doi: 10.1038/s42003-022-04008-1. Commun Biol. 2022. PMID: 36184676 Free PMC article.
-
Overexpression of Tfap2a in Mouse Oocytes Impaired Spindle and Chromosome Organization.Int J Mol Sci. 2022 Nov 19;23(22):14376. doi: 10.3390/ijms232214376. Int J Mol Sci. 2022. PMID: 36430853 Free PMC article.
References
-
- Mattson B. A. & Albertini D. F. Oogenesis: chromatin and microtubule dynamics during meiotic prophase. Mol Reprod Dev 25, 374–383 (1990). - PubMed
-
- Wickramasinghe D., Ebert K. M. & Albertini D. F. Meiotic competence acquisition is associated with the appearance of M-phase characteristics in growing mouse oocytes. Dev Biol 143, 162–172 (1991). - PubMed
-
- Debey P. et al.. Competent mouse oocytes isolated from antral follicles exhibit different chromatin organization and follow different maturation dynamics. Mol Reprod Dev 36, 59–74 (1993). - PubMed
-
- Zuccotti M., Piccinelli A., Giorgi R. P., Garagna S. & Redi C. A. Chromatin organization during mouse oocyte growth. Mol Reprod Dev 41, 479–485 (1995). - PubMed
-
- De L. & Fuente R. Chromatin modifications in the germinal vesicle (GV) of mammalian oocytes. Dev Biol 292, 1–12 (2006). - PubMed
Publication types
MeSH terms
Substances
LinkOut - more resources
Full Text Sources
Other Literature Sources
Research Materials
Miscellaneous
