. 2016 Aug;26(8):1023-33.
doi: 10.1101/gr.204834.116. Epub 2016 Jun 16.

High-throughput functional comparison of promoter and enhancer activities

Affiliations

High-throughput functional comparison of promoter and enhancer activities

Thomas A Nguyen et al. Genome Res. 2016 Aug.

Abstract

Promoters initiate RNA synthesis, and enhancers stimulate promoter activity. Whether promoter and enhancer activities are encoded distinctly in DNA sequences is unknown. We measured the enhancer and promoter activities of thousands of DNA fragments transduced into mouse neurons. We focused on genomic loci bound by the neuronal activity-regulated coactivator CREBBP, and we measured enhancer and promoter activities both before and after neuronal activation. We find that the same sequences typically encode both enhancer and promoter activities. However, gene promoters generate more promoter activity than distal enhancers, despite generating similar enhancer activity. Surprisingly, the greater promoter activity of gene promoters is not due to conventional core promoter elements or splicing signals. Instead, we find that particular transcription factor binding motifs are intrinsically biased toward the generation of promoter activity, whereas others are not. Although the specific biases we observe may be dependent on experimental or cellular context, our results suggest that gene promoters are distinguished from distal enhancers by specific complements of transcriptional activators.


Figures

Figure 1.
Figure 1.
Measuring thousands of promoter and enhancer activities in primary neurons using Massively Parallel Reporter Assays (MPRAs). (A) For each of 234 CREBBP-bound promoter and 253 CREBBP-bound distal enhancer loci, we synthesized 11 139-bp tiles whose start sites are spaced at 20-bp intervals. The center tile at each locus is centered on the called CREBBP peak. Plots show tile coverage as a count of quantifiable tiles versus position relative to the locus center. Distal enhancers are at least 500 bp from an annotated TSS. (B) After a series of cloning steps (Supplemental Figs. S1, S2), we tagged each tile with one or more unique 18-bp barcodes. In the enhancer test, the abundance of each barcode in a cellular mRNA pool depends on the enhancer activity of its associated tile. The library contains a mix of tiles from enhancer (black) and promoter (orange) loci. pFos is a 100-bp basal FOS promoter. (C) In the promoter test, the abundance of each barcode depends on the promoter activity of its tile. (D) We packaged MPRA libraries into AAV for infection of mouse cortical neurons and quantified cDNA and control DNA barcode abundance by sequencing. We typically sequenced control DNA amplified from the plasmid library rather than from cells, because we found MPRA read counts from plasmid DNA and DNA extracted from neurons to be indistinguishable (Supplemental Fig. S3C).
Figure 2.
Figure 2.
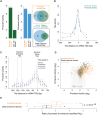
Replicability of enhancer and promoter activities from MPRAs. (A) Replicability of read counts across two biological replicates of an enhancer activity MPRA. (B) Replicability of enhancer activity from A. MPRA activity is defined in this and all subsequent figures as the cDNA to DNA ratio, normalized to the corresponding ratio for negative control sequences, which are included in each MPRA library. (C) Schematic of luciferase assay design. Enhancer activity was assessed with test sequences upstream of a minimal FOS promoter. Promoter activity was tested as in Figure 1C with a luciferase coding sequence in place of GFP. (D) Comparison of MPRA-based and luciferase-based enhancer activity measurements, with each shape representing a specific test sequence. Test sequences are artificial, with repeats of RFX (square), AP1 (circle), MYBL2 (triangle), and NFYshort (diamond) motifs with spacers TTATTTTAAGA (RFX, MYBL2) and CCCGCGCTGCC (AP1, NFYshort). (EG) Same as A,B,D but for promoter activity. (H) Correlation of MPRA-based promoter activity with CAGE tag counts. Pearson's R = 0.27, P < 10−16 from t-statistic. Throughout this work, except where noted, enhancer and promoter activities are reported as the maximal activity of the unstimulated and KCl-depolarized conditions. In A, B, E, and F, the unstimulated condition is shown.
Figure 3.
Figure 3.
Promoter and enhancer activities are positively correlated but quantitatively decoupled. (A) Mean promoter and enhancer activities across all promoter-derived and distal enhancer-derived tiles and the numbers of tiles with significant promoter or enhancer activities (FDR 0.1). (B) Mean promoter and enhancer activity as a function of the distance of the center of MPRA tiles to the nearest RefSeq TSS. Negative distances correspond to tile locations upstream of the TSS. (C) Mean promoter activity for tiles cloned into the MPRA promoter test in sense (566 tiles) versus antisense (467 tiles) orientations relative to their endogenous mRNA TSS. The genomic antisense TSS position depicts the approximate location of the endogenous antisense TSS, based on a median 180-bp distance between sense and antisense TSSs (Scruggs et al. 2015). (D) Enhancer activity versus promoter activity, with each dot corresponding to one tile. Each tile's activities are shown once for unstimulated and once for KCl-depolarized neurons. The area in which both activities fall above an empirical FDR of 0.1 is shown in gray. (E) The ratio of promoter-to-enhancer activities of tiles derived from promoter and distal enhancer loci (P-value from two-tailed Student's t-test). Error bars in AC indicate SEM for n = 2 independent biological replications. Promoter and enhancer activities are defined as in Figure 2B.
Figure 4.
Figure 4.
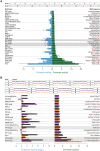
Promoter activity more than enhancer activity is associated with CpG content. (A) The enhancer and promoter activities of mouse genomic DNA tiles ranked by the CpG dinucleotide frequency in each tile. (B) We tiled human promoter and distal enhancer loci that are orthologous to selected mouse loci. (C) The enhancer and promoter activities of 725 human genomic tiles ranked by CpG frequency. (D) The enhancer and promoter activities of 764 reversed human genomic control tiles ranked by CpG frequency. (E) The 28 most-enriched TF motifs in tiles with a CpG fraction >0.087, compared to reversed controls. The highest-scoring matches in the JASPAR database were chosen as the TF motif names, and six additional motifs without clear TF matches are in Supplemental Table S2. The number of CpG dinucleotides in each motif is indicated in red. In A, C, and D, each value is a mean from n = 2 biological replicates. Promoter and enhancer activities are defined as in Figure 2B.
Figure 5.
Figure 5.
Motifs differ in their intrinsic biases toward the generation of promoter versus enhancer activities. (A, top) Sequence design for tandem repeats of 32 motifs, each totaling 87 bp in length; (bottom) enhancer and promoter activities of motif tandem repeats. (B, top) Sequence design for spaced motif repeats, with 18 motifs and three spacer sequences, each totaling 87 bp in length; (bottom) enhancer and promoter activities of spaced motif sequences. The log2 of enhancer activity is shown. Stars indicate at least twofold activity with significance in a one-sided Student's t-test (P < 0.05). Error bars are SEM of n = 3 biological replicates. Promoter and enhancer activities are defined as in Figure 2B.
Figure 6.
Figure 6.
Motifs and their corresponding transcription factors exhibit specific preferences for promoters or distal enhancers in the genome. (A) Motifs with at least twofold enrichment at mouse gene promoters or distal CREBBP-bound enhancers, relative to corresponding flanking sequences. Motifs corresponding to CREB, RFX, and AP1 are labeled for the 10 most enriched motifs at gene promoters or distal enhancers. For colored motifs, enrichment at both classes of loci is significant (P < 10−5, Bonferroni-corrected binomial test). (B) Percentages of cortical neuron CREB, RFX, and AP1 ChIP-seq peaks located at gene promoters (top) and distal enhancers (bottom). Antibodies used were anti-CREB, anti-FOS (AP1), and anti-MYC (with MYC-tagged RFX dominant negative): (*) P < 10−14 by a hypergeometric test.
Figure 7.
Figure 7.
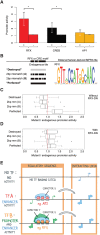
The promoter activity of distal enhancers requires RFX motifs. (A) Mean promoter activity of distal enhancer tiles that have zero (“−”) or at least two (“+”) occurrences of RFX, CREB, and AP1 motifs: (*) P < 0.05 by Student's t-test. Promoter activity is defined and normalized as in Figure 2B, and each tile's mean promoter activity from two biological replicates is averaged across all “+” and “−” tiles. The apparent lack of error bars in “−” tiles is due to the mean and SEM being computed across a large number of tiles, because most tiles lack these motifs. (B) Mutations of RFX motif occurrences within distal enhancer sequences. Each motif occurrence was altered in four different ways. A gray portion indicates a nucleotide that does not match the corresponding motif represented at right. Motifs are from HT SELEX position frequency matrices for RFX5 (Jolma et al. 2013). (C) Ratios of mutant to control promoter activity using MPRAs, with median and 25th–75th percentiles shown as bars and boxes. A ratio of one (no change in promoter activity) is indicated with a vertical red line. Promoter activity is defined as in Figure 2B. The 20 control tiles include 11 distal enhancer tiles, shown separately in Supplemental Figure S5F. (D) Same as C but for RFX dominant negative-transduced neurons. (E) Model: Transcriptional activators and coactivators determine the relative extent of enhancer and promoter activities.

Similar articles

Cited by

References

    1. Almada AE, Wu X, Kriz AJ, Burge CB, Sharp PA. 2013. Promoter directionality is controlled by U1 snRNP and polyadenylation signals. Nature 499: 360–363. - PMC - PubMed
    1. Andersson R, Gebhard C, Miguel-Escalada I, Hoof I, Bornholdt J, Boyd M, Chen Y, Zhao X, Schmidl C, Suzuki T, et al. 2014. An atlas of active enhancers across human cell types and tissues. Nature 507: 455–461. - PMC - PubMed
    1. Andersson R, Sandelin A, Danko CG. 2015. A unified architecture of transcriptional regulatory elements. Trends Genet 31: 426–433. - PubMed
    1. Arner E, Daub CO, Vitting-Seerup K, Andersson R, Lilje B, Drabløs F, Lennartsson A, Rönnerblad M, Hrydziuszko O, Vitezic M, et al. 2015. Transcribed enhancers lead waves of coordinated transcription in transitioning mammalian cells. Science 347: 1010–1014. - PMC - PubMed
    1. Arnold CD, Gerlach D, Stelzer C, Boryń ŁM, Rath M, Stark A. 2013. Genome-wide quantitative enhancer activity maps identified by STARR-seq. Science 339: 1074–1077. - PubMed

Publication types