Natural history of the infant gut microbiome and impact of antibiotic treatment on bacterial strain diversity and stability
- PMID: 27306663
- PMCID: PMC5032909
- DOI: 10.1126/scitranslmed.aad0917
Natural history of the infant gut microbiome and impact of antibiotic treatment on bacterial strain diversity and stability
Abstract
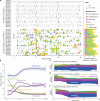
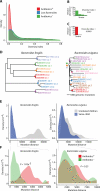
The gut microbial community is dynamic during the first 3 years of life, before stabilizing to an adult-like state. However, little is known about the impact of environmental factors on the developing human gut microbiome. We report a longitudinal study of the gut microbiome based on DNA sequence analysis of monthly stool samples and clinical information from 39 children, about half of whom received multiple courses of antibiotics during the first 3 years of life. Whereas the gut microbiome of most children born by vaginal delivery was dominated by Bacteroides species, the four children born by cesarean section and about 20% of vaginally born children lacked Bacteroides in the first 6 to 18 months of life. Longitudinal sampling, coupled with whole-genome shotgun sequencing, allowed detection of strain-level variation as well as the abundance of antibiotic resistance genes. The microbiota of antibiotic-treated children was less diverse in terms of both bacterial species and strains, with some species often dominated by single strains. In addition, we observed short-term composition changes between consecutive samples from children treated with antibiotics. Antibiotic resistance genes carried on microbial chromosomes showed a peak in abundance after antibiotic treatment followed by a sharp decline, whereas some genes carried on mobile elements persisted longer after antibiotic therapy ended. Our results highlight the value of high-density longitudinal sampling studies with high-resolution strain profiling for studying the establishment and response to perturbation of the infant gut microbiome.
Copyright © 2016, American Association for the Advancement of Science.
Figures


Comment in
-
Gut microbiota: First steps in the infant gut microbiota.Nat Rev Gastroenterol Hepatol. 2016 Aug;13(8):437. doi: 10.1038/nrgastro.2016.108. Epub 2016 Jul 6. Nat Rev Gastroenterol Hepatol. 2016. PMID: 27381073 No abstract available.
Similar articles
-
Maternal diet during pregnancy is related with the infant stool microbiome in a delivery mode-dependent manner.Microbiome. 2018 Jul 5;6(1):109. doi: 10.1186/s40168-018-0490-8. Microbiome. 2018. PMID: 29973274 Free PMC article.
-
Impact of maternal intrapartum antibiotics, method of birth and breastfeeding on gut microbiota during the first year of life: a prospective cohort study.BJOG. 2016 May;123(6):983-93. doi: 10.1111/1471-0528.13601. Epub 2015 Sep 28. BJOG. 2016. PMID: 26412384
-
Antibiotic perturbation of the preterm infant gut microbiome and resistome.Gut Microbes. 2016 Sep 2;7(5):443-9. doi: 10.1080/19490976.2016.1218584. Epub 2016 Jul 29. Gut Microbes. 2016. PMID: 27472377 Free PMC article. Review.
-
Delivery mode is a larger determinant of infant gut microbiome composition at 6 weeks than exposure to peripartum antibiotics.Microb Genom. 2024 Jul;10(7):001269. doi: 10.1099/mgen.0.001269. Microb Genom. 2024. PMID: 38995243 Free PMC article.
-
Antibiotics and the developing infant gut microbiota and resistome.Curr Opin Microbiol. 2015 Oct;27:51-6. doi: 10.1016/j.mib.2015.07.007. Epub 2015 Aug 1. Curr Opin Microbiol. 2015. PMID: 26241507 Free PMC article. Review.
Cited by
-
The Beneficial Effects of Dietary Interventions on Gut Microbiota-An Up-to-Date Critical Review and Future Perspectives.Nutrients. 2023 Dec 3;15(23):5005. doi: 10.3390/nu15235005. Nutrients. 2023. PMID: 38068863 Free PMC article. Review.
-
Parental, Perinatal, and Childhood Risk Factors for Development of Irritable Bowel Syndrome: A Systematic Review.J Neurogastroenterol Motil. 2020 Sep 30;26(4):437-446. doi: 10.5056/jnm20109. J Neurogastroenterol Motil. 2020. PMID: 32989183 Free PMC article.
-
Does Lactobacillus Exert a Protective Effect on the Development of Cervical and Endometrial Cancer in Women?Cancers (Basel). 2022 Oct 7;14(19):4909. doi: 10.3390/cancers14194909. Cancers (Basel). 2022. PMID: 36230832 Free PMC article. Review.
-
Translational metagenomics and the human resistome: confronting the menace of the new millennium.J Mol Med (Berl). 2017 Jan;95(1):41-51. doi: 10.1007/s00109-016-1478-0. Epub 2016 Oct 20. J Mol Med (Berl). 2017. PMID: 27766372 Free PMC article. Review.
-
Evolutionary Significance of the Neuroendocrine Stress Axis on Vertebrate Immunity and the Influence of the Microbiome on Early-Life Stress Regulation and Health Outcomes.Front Microbiol. 2021 Apr 7;12:634539. doi: 10.3389/fmicb.2021.634539. eCollection 2021. Front Microbiol. 2021. PMID: 33897639 Free PMC article. Review.
References
-
- Gevers D, Kugathasan S, Denson LA, Vazquez-Baeza Y, Van Treuren W, Ren B, Schwager E, Knights D, Song SJ, Yassour M, Morgan XC, Kostic AD, Luo C, Gonzalez A, McDonald D, Haberman Y, Walters T, Baker S, Rosh J, Stephens M, Heyman M, Markowitz J, Baldassano R, Griffiths A, Sylvester F, Mack D, Kim S, Crandall W, Hyams J, Huttenhower C, Knight R, Xavier RJ. The treatment-naive microbiome in new-onset Crohn's disease. Cell Host Microbe. 2014;15:382–392. - PMC - PubMed
-
- Qin J, Li Y, Cai Z, Li S, Zhu J, Zhang F, Liang S, Zhang W, Guan Y, Shen D, Peng Y, Zhang D, Jie Z, Wu W, Qin Y, Xue W, Li J, Han L, Lu D, Wu P, Dai Y, Sun X, Li Z, Tang A, Zhong S, Li X, Chen W, Xu R, Wang M, Feng Q, Gong M, Yu J, Zhang Y, Zhang M, Hansen T, Sanchez G, Raes J, Falony G, Okuda S, Almeida M, LeChatelier E, Renault P, Pons N, Batto JM, Zhang Z, Chen H, Yang R, Zheng W, Li S, Yang H, Wang J, Ehrlich SD, Nielsen R, Pedersen O, Kristiansen K, Wang J. A metagenome-wide association study of gut microbiota in type 2 diabetes. Nature. 2012;490:55–60. - PubMed
Publication types
MeSH terms
Substances
Grants and funding
LinkOut - more resources
Full Text Sources
Other Literature Sources
Medical
Molecular Biology Databases

