

Feed-forward and reciprocal inhibition for gain and phase timing control in a computational model of repetitive cough
- PMID: 27283917
- PMCID: PMC4967248
- DOI: 10.1152/japplphysiol.00790.2015
Feed-forward and reciprocal inhibition for gain and phase timing control in a computational model of repetitive cough
Abstract
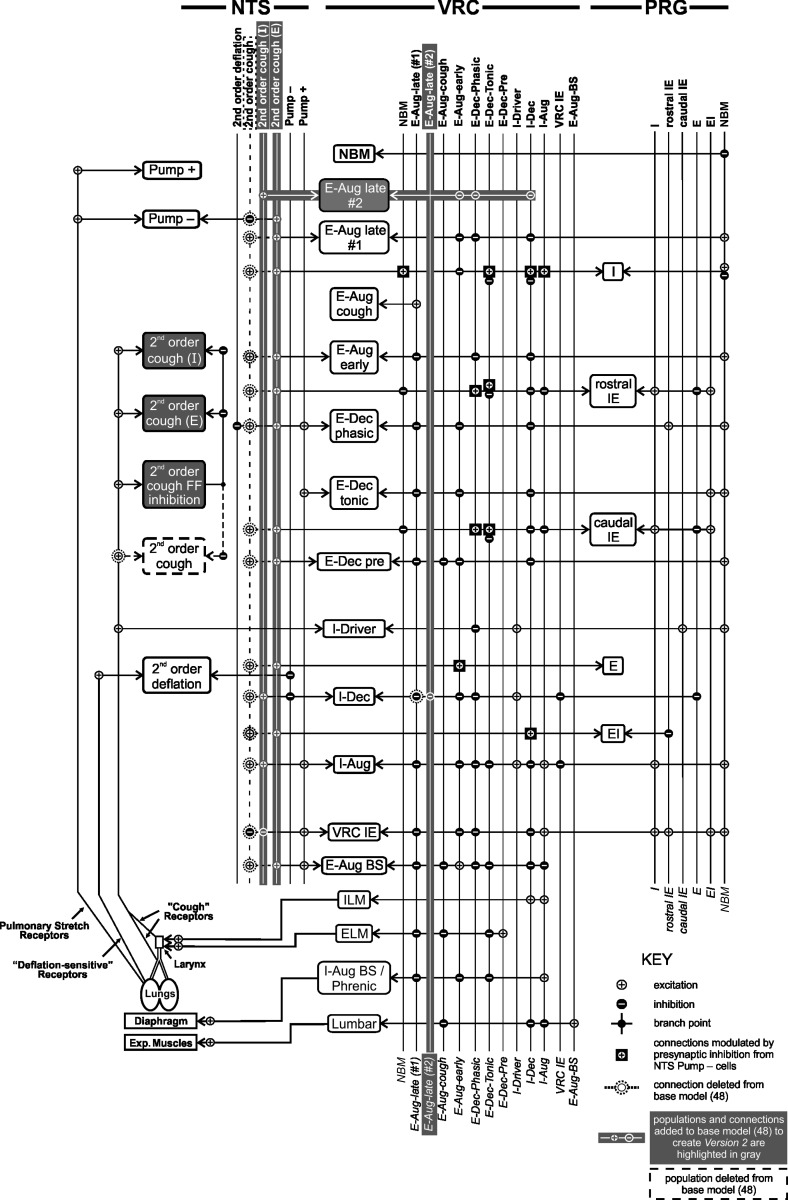
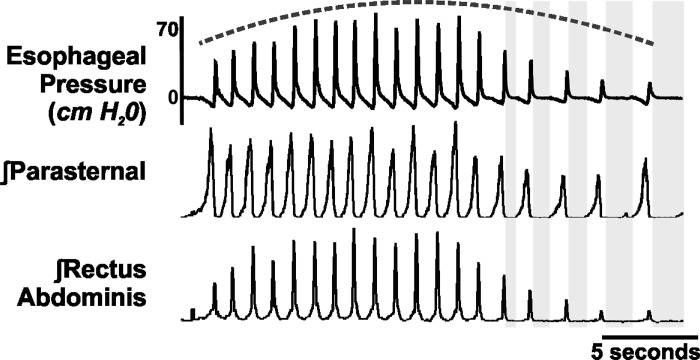
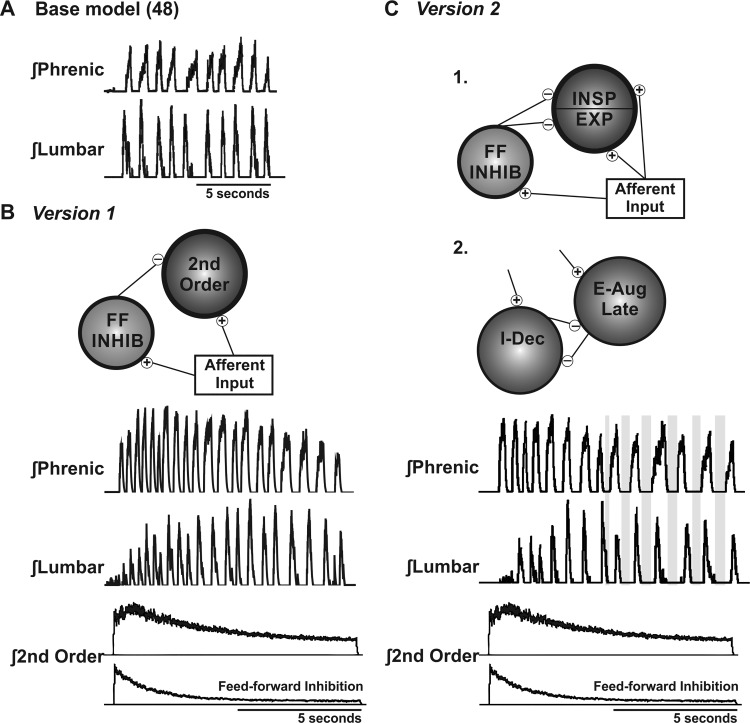
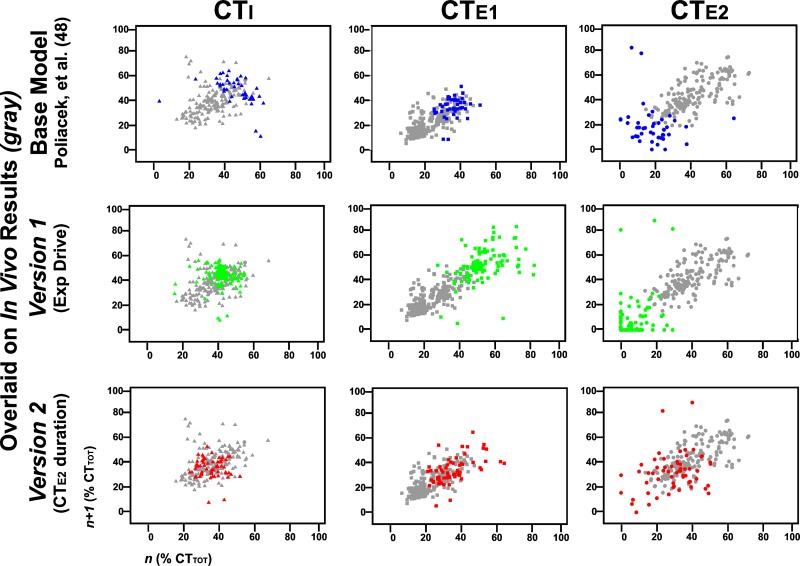
We investigated the hypothesis, motivated in part by a coordinated computational cough network model, that second-order neurons in the nucleus tractus solitarius (NTS) act as a filter and shape afferent input to the respiratory network during the production of cough. In vivo experiments were conducted on anesthetized spontaneously breathing cats. Cough was elicited by mechanical stimulation of the intrathoracic airways. Electromyograms of the parasternal (inspiratory) and rectus abdominis (expiratory) muscles and esophageal pressure were recorded. In vivo data revealed that expiratory motor drive during bouts of repetitive coughs is variable: peak expulsive amplitude increases from the first cough, peaks about the eighth or ninth cough, and then decreases through the remainder of the bout. Model simulations indicated that feed-forward inhibition of a single second-order neuron population is not sufficient to account for this dynamic feature of a repetitive cough bout. When a single second-order population was split into two subpopulations (inspiratory and expiratory), the resultant model produced simulated expiratory motor bursts that were comparable to in vivo data. However, expiratory phase durations during these simulations of repetitive coughing had less variance than those in vivo. Simulations in which reciprocal inhibitory processes between inspiratory-decrementing and expiratory-augmenting-late neurons were introduced exhibited increased variance in the expiratory phase durations. These results support the prediction that serial and parallel processing of airway afferent signals in the NTS play a role in generation of the motor pattern for cough.
Keywords: airway protection; computational modeling; cough; in vivo; inhibition.
Copyright © 2016 the American Physiological Society.
Figures
Similar articles
-
Differential effects of acute cerebellectomy on cough in spontaneously breathing cats.PLoS One. 2021 Jun 21;16(6):e0253060. doi: 10.1371/journal.pone.0253060. eCollection 2021. PLoS One. 2021. PMID: 34153070 Free PMC article.
-
Blood pressure changes alter tracheobronchial cough: computational model of the respiratory-cough network and in vivo experiments in anesthetized cats.J Appl Physiol (1985). 2011 Sep;111(3):861-73. doi: 10.1152/japplphysiol.00458.2011. Epub 2011 Jun 30. J Appl Physiol (1985). 2011. PMID: 21719729 Free PMC article.
-
Microinjection of kynurenic acid in the rostral nucleus of the tractus solitarius disrupts spatiotemporal aspects of mechanically induced tracheobronchial cough.J Neurophysiol. 2017 Jun 1;117(6):2179-2187. doi: 10.1152/jn.00935.2016. Epub 2017 Mar 1. J Neurophysiol. 2017. PMID: 28250153 Free PMC article.
-
Role of the dorsal medulla in the neurogenesis of airway protection.Pulm Pharmacol Ther. 2015 Dec;35:105-10. doi: 10.1016/j.pupt.2015.10.012. Epub 2015 Nov 5. Pulm Pharmacol Ther. 2015. PMID: 26549786 Free PMC article. Review.
-
Midbrain control of breathing and blood pressure: The role of periaqueductal gray matter and mesencephalic collicular neuronal microcircuit oscillators.Eur J Neurosci. 2020 Oct;52(8):3879-3902. doi: 10.1111/ejn.14727. Epub 2020 May 1. Eur J Neurosci. 2020. Retraction in: Eur J Neurosci. 2021 Oct;54(7):6685. doi: 10.1111/ejn.15484 PMID: 32227408 Retracted. Review.
Cited by
-
Influence of intrathoracic vagotomy on the cough reflex in the anesthetized cat.Respir Physiol Neurobiol. 2022 Feb;296:103805. doi: 10.1016/j.resp.2021.103805. Epub 2021 Oct 19. Respir Physiol Neurobiol. 2022. PMID: 34678475 Free PMC article.
-
Role of the dorsomedial medulla in suppression of cough by codeine in cats.Respir Physiol Neurobiol. 2017 Dec;246:59-66. doi: 10.1016/j.resp.2017.07.011. Epub 2017 Aug 1. Respir Physiol Neurobiol. 2017. PMID: 28778649 Free PMC article.
-
Cough modulation by upper airway stimuli in cat - potential clinical application?Open J Mol Integr Physiol. 2016 Aug;6(3):35-43. doi: 10.4236/ojmip.2016.63004. Epub 2016 Aug 22. Open J Mol Integr Physiol. 2016. PMID: 28944100 Free PMC article.
-
Differential effects of acute cerebellectomy on cough in spontaneously breathing cats.PLoS One. 2021 Jun 21;16(6):e0253060. doi: 10.1371/journal.pone.0253060. eCollection 2021. PLoS One. 2021. PMID: 34153070 Free PMC article.
-
The role of neuronal excitation and inhibition in the pre-Bötzinger complex on the cough reflex in the cat.J Neurophysiol. 2022 Jan 1;127(1):267-278. doi: 10.1152/jn.00108.2021. Epub 2021 Dec 8. J Neurophysiol. 2022. PMID: 34879205 Free PMC article.
References
-
- Birkebæk NH, Kristiansen M, Seefeldt T, Degn J, Møller A, Heron I, Andersen PL, Møller JK, Østergård L. Bordetella pertussis and chronic cough in adults. Clin Infect Dis 29: 1239–1242, 1999. - PubMed
MeSH terms
Grants and funding
LinkOut - more resources
Full Text Sources
Other Literature Sources
Medical
Miscellaneous