Meta-Analysis
. 2016 Jul 27;44(13):6070-86.
doi: 10.1093/nar/gkw523. Epub 2016 Jun 8.

Integration of TP53, DREAM, MMB-FOXM1 and RB-E2F target gene analyses identifies cell cycle gene regulatory networks

Affiliations
Meta-Analysis

Integration of TP53, DREAM, MMB-FOXM1 and RB-E2F target gene analyses identifies cell cycle gene regulatory networks

Martin Fischer et al. Nucleic Acids Res. .

Abstract

Cell cycle (CC) and TP53 regulatory networks are frequently deregulated in cancer. While numerous genome-wide studies of TP53 and CC-regulated genes have been performed, significant variation between studies has made it difficult to assess regulation of any given gene of interest. To overcome the limitation of individual studies, we developed a meta-analysis approach to identify high confidence target genes that reflect their frequency of identification in independent datasets. Gene regulatory networks were generated by comparing differential expression of TP53 and CC-regulated genes with chromatin immunoprecipitation studies for TP53, RB1, E2F, DREAM, B-MYB, FOXM1 and MuvB. RNA-seq data from p21-null cells revealed that gene downregulation by TP53 generally requires p21 (CDKN1A). Genes downregulated by TP53 were also identified as CC genes bound by the DREAM complex. The transcription factors RB, E2F1 and E2F7 bind to a subset of DREAM target genes that function in G1/S of the CC while B-MYB, FOXM1 and MuvB control G2/M gene expression. Our approach yields high confidence ranked target gene maps for TP53, DREAM, MMB-FOXM1 and RB-E2F and enables prediction and distinction of CC regulation. A web-based atlas at www.targetgenereg.org enables assessing the regulation of any human gene of interest.


Figures

Figure 1.
Figure 1.
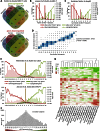
Meta-analysis of TP53-dependent gene expression. (A) Venn diagram displaying the overlap of genes that were detected as upregulated or downregulated by TP53 activation in datasets from Nikulenkov et al., Zaccara et al., Loayza-Puch et al. and Janky et al. (B) In each dataset on TP53-dependent gene regulation, a gene can be found as upregulated ‘+1’, downregulated ‘−1’ or not regulated ‘0’. The number of genes identified in a Nutlin-3a MCF-7 dataset as either upregulated or downregulated is compared to the sum of the remaining three datasets from Nutlin-3a treated MCF-7 cells (see Supplementary Figure S1A–D for more). (C) The number of genes identified in datasets from other cell types treated with Nutlin-3a compared to the sum of the four Nutlin-3a MCF-7 datasets (see Supplementary Figure S1E–I for more) (D) Boxplot displaying the sum of the five doxorubicin datasets compared to the sum of the nine Nutlin-3a datasets. Correlation coefficient and two-tailed P-value was calculated using GraphPad Prism version 6.00. (E) Integration of 20 datasets on TP53-dependent gene regulation from multiple cell types and treatments. The number of genes identified in each dataset as either upregulated or downregulated is compared to the sum of the remaining 19 datasets (see Supplementary Figures S3 and 4). (B, C and E) A two-sided Fisher's exact test was employed to test for significant over- and under-representation of gene sets and P-values were adjusted for multiple testing using Bonferroni correction. Colored and black data points are significantly over- and under-represented, respectively (adj. P-value ≤ 0.05). White data points are not significantly different. (F) Hierarchical clustering of the 10 000 most variant genes across the 20 TP53 datasets. (G) The number of genes is displayed that is found in each of the 41 p53 Expression Score groups.
Figure 2.
Figure 2.
Proximal TP53 binding correlates with transcriptional activation. Boxplot displaying the number of ChIP datasets that find a gene to be bound by TP53 within (A) ±25 kb, (B) ±2.5 kb and (C) ±25 kb but not within ±2.5 kb of their TSS across the 41 p53 Expression Score groups. Correlation coefficient and two-tailed P-value was calculated using GraphPad Prism version 6.00. (D) Top 15 BP GO terms with their FDR value as identified using the DAVID Functional Annotation Tool (53) enriched at genes that are found down- (left) or upregulated (right) in at least half of the 20 datasets. The number of (E) DREAM (17) bound genes across the 41 p53 Expression Score groups. A two-sided Fisher's exact test was employed to test for significant over- and under-representation of gene sets and P-values were adjusted for multiple testing using Bonferroni correction. Colored and black data points are significantly over- and under-represented, respectively (adj. P-value ≤ 0.05). White data points are not significantly different. (F) A heatmap displaying the regulation of 20 well-established TP53 or DREAM target genes across the 20 datasets on TP53-dependent gene regulation. GAPDH and GAPDHS serve as negative controls.
Figure 3.
Figure 3.
Downregulation upon TP53 induction requires p21. The number of genes identified in HCT116 p21−/− cells treated with (A) Nutlin-3a or (B) doxorubicin as either upregulated or downregulated is compared to the 41 p53 Expression Score groups. (C) The number of genes identified as regulated in Nutlin-3a treated HCT116 p21−/− cells is compared to the nine Nutlin-3a datasets. (D) The number of genes identified as regulated in doxorubicin treated HCT116 p21−/− cells is compared to the five doxorubicin datasets. A two-sided Fisher's exact test was employed to test for significant over- and under-representation of gene sets and P-values were adjusted for multiple testing using Bonferroni correction. Colored and black data points are significantly over- and under-represented, respectively (adj. P-value ≤ 0.05). White data points are not significantly different.
Figure 4.
Figure 4.
Cell cycle (CC) genes are downregulated by TP53 and bind the DREAM complex. (A) Venn diagram displaying the overlap between the five CC datasets. (B) The number of genes identified in each of the five CC datasets is compared to the number of the remaining datasets that identify these genes. (C)The number of DREAM bound genes (Litovchick et al., (17)) is compared to the number of datasets that identify a gene as CC gene. A two-sided Fisher's exact test was employed to test for significant over- and under-representation of gene sets and P-values were adjusted for multiple testing using Bonferroni correction. (D) Boxplot displaying the number of datasets that find a gene to be a CC gene across the 41 p53 Expression Score groups. Correlation coefficient and two-tailed P-value was calculated using GraphPad Prism version 6.00. (E) Top 15 BP GO terms with their FDR value as identified using the DAVID Functional Annotation Tool (53) enriched at genes that display a p53 Expression Score ≤ −12 (left) or −9 to −11 (right) that were not identified as CC gene. (F) Significant CC regulation was tested for 21 TP53 repressed genes and the negative controls U6 and GAPDH using an unpaired Student's t-test for data from time points 0 to 10 h and 16 to 30 h and P-values were adjusted for multiple testing using Bonferroni correction (see Supplemental Figure S10).
Figure 5.
Figure 5.
Prediction and validation of candidate DREAM target genes. (A and B) Protein binding to promoters of the indicated genes was tested by ChIP in serum starved (G0) and 22 h re-stimulated (G2/M) T98G cells. The E2F1 and MYBL2 promoters served as a positive control for DREAM binding; the GAPDHS promoter was used as a negative control. One representative experiment with three technical replicates (n = 3) is displayed. Venn diagram of overlaps between genes identified as bound in the (C) E2F4 or (F) p130 ChIP-seq datasets. The number of common (D) E2F4 or (G) p130 bound genes is compared to the number of datasets that identify a gene as being a CC gene. The number of common (E) E2F4 or (H) p130 bound genes in the 41 p53 Expression Score groups. A two-sided Fisher's exact test was employed to test for significant over- and under-representation of gene sets and P-values were adjusted for multiple testing using Bonferroni correction. Colored and black data points are significantly over- and under-represented, respectively (adj. P-value ≤ 0.05). White data points are not significantly different. (I) Boxplot displaying the number of datasets that find a gene to be targeted by DREAM compared to the number of datasets that identify a gene as CC regulated. (J) Boxplot displaying the number of datasets that find a gene to be targeted by DREAM in the 41 p53 Expression Score groups. Correlation coefficient and two-tailed P-value was calculated using GraphPad Prism version 6.00.
Figure 6.
Figure 6.
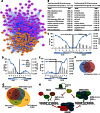
DREAM target genes comprise distinct subgroups regulated by RB-E2F and MMB-FOXM1. (A) Message passing clustering of 259 high confidence CC genes based on their protein–protein interaction network obtained from string-db. (B) Top 10 BP GO terms with their FDR value as identified using the DAVID Functional Annotation Tool (53) enriched at genes that are found to be G1/S (left) or G2/M (right) CC genes in at least three of the five CC datasets. The number of (C) DREAM targets, (D) RB-E2F target genes and (E) MMB-FOXM1 targets in the 11 CC Expression Score groups. A two-sided Fisher's exact test was employed to test for significant over- and under-representation of gene sets and P-values were adjusted for multiple testing using Bonferroni correction. Colored and black data points are significantly over- and under-represented, respectively (adj. P-value ≤ 0.05). Venn diagram of predicted CC genes and (F) genes downregulated by TP53 (p53 Expression Score ≤ −5) or (G) DREAM, MMB-FOXM1 and RB-E2F targets. (H) The TP53 target p21 (CDKN1A) is required for downregulation by TP53. CC genes are downregulated by TP53 and bound by the DREAM complex. RB-E2F and MMB-FOXM1 bind discrete subsets of DREAM targets reflecting G1/S and G2/M CC genes.
Figure 7.
Figure 7.
Predicted direct target gene network governed by TP53, DREAM, MMB-FOXM1 and RB-E2F. Octagons represent the transcriptional regulators. All other nodes represent target genes. Edges represent predicted direct regulation. The size of the nodes reflects the number of CC datasets that identify the gene as CC regulated. The node color reflects the gene's p53 Expression Score.

Similar articles

Cited by

References

    1. Riley T., Sontag E., Chen P., Levine A. Transcriptional control of human p53-regulated genes. Nat. Rev. Mol. Cell Biol. 2008;9:402–412. - PubMed
    1. Beckerman R., Prives C. Transcriptional regulation by p53. Cold Spring Harb.Perspect.Biol. 2010;2:a000935. - PMC - PubMed
    1. Wei C.L., Wu Q., Vega V.B., Chiu K.P., Ng P., Zhang T., Shahab A., Yong H.C., Fu Y., Weng Z., et al. A global map of p53 transcription-factor binding sites in the human genome. Cell. 2006;124:207–219. - PubMed
    1. Smeenk L., van Heeringen S.J., Koeppel M., Gilbert B., Janssen-Megens E., Stunnenberg H.G., Lohrum M. Role of p53 Serine 46 in p53 Target Gene Regulation. PLoS One. 2011;6:e17574. - PMC - PubMed
    1. Nikulenkov F., Spinnler C., Li H., Tonelli C., Shi Y., Turunen M., Kivioja T., Ignatiev I., Kel A., Taipale J., et al. Insights into p53 transcriptional function via genome-wide chromatin occupancy and gene expression analysis. Cell Death Differ. 2012;19:1992–2002. - PMC - PubMed

Publication types

MeSH terms