

Optimized automated data analysis for the cytokinesis-block micronucleus assay using imaging flow cytometry for high throughput radiation biodosimetry
- PMID: 27272602
- PMCID: PMC5089661
- DOI: 10.1002/cyto.a.22887
Optimized automated data analysis for the cytokinesis-block micronucleus assay using imaging flow cytometry for high throughput radiation biodosimetry
Abstract
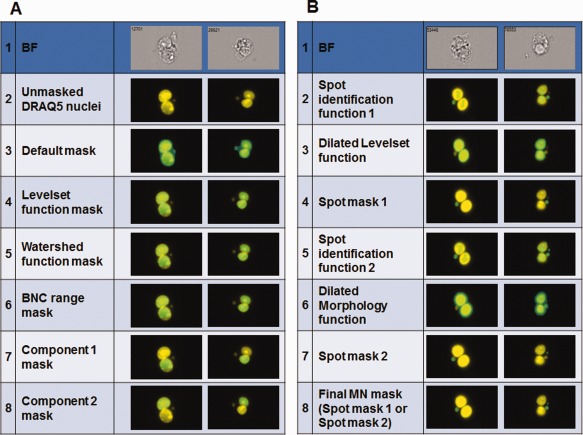
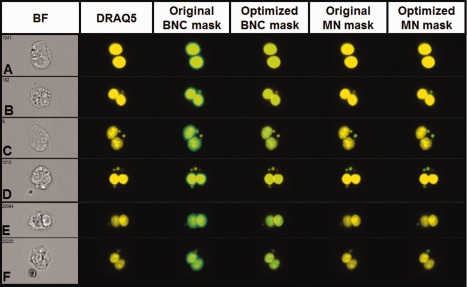
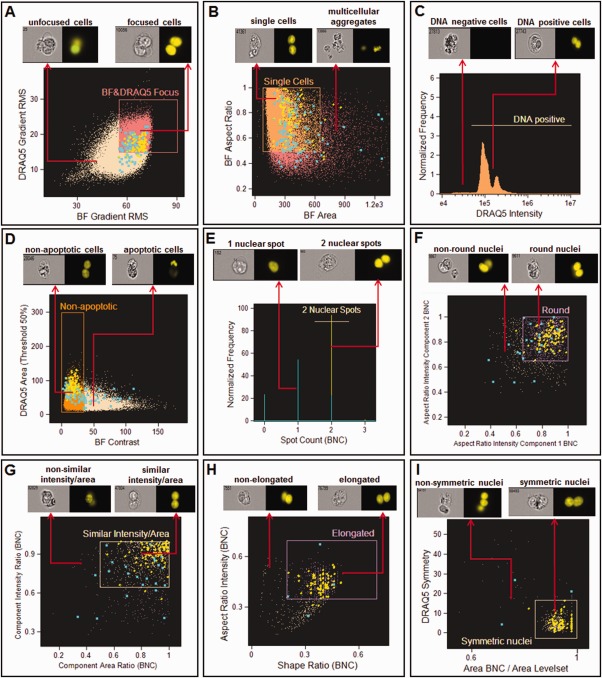
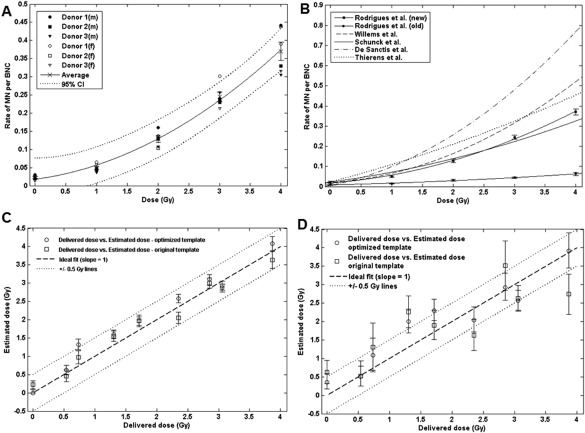
The cytokinesis-block micronucleus (CBMN) assay is a well-established technique that can be employed in triage radiation biodosimetry to estimate whole body doses of radiation to potentially exposed individuals through quantitation of the frequency of micronuclei (MN) in binucleated lymphocyte cells (BNCs). The assay has been partially automated using traditional microscope-based methods and most recently has been modified for application on the ImageStream(X) (IS(X) ) imaging flow cytometer. This modification has allowed for a similar number of BNCs to be automatically scored as compared to traditional microscopy in a much shorter time period. However, the MN frequency measured was much lower than both manual and automated slide-based methods of performing the assay. This work describes the optimized analysis template which implements newly developed functions in the IDEAS(®) data analysis software for the IS(X) that enhances specificity for BNCs and increases the frequency of scored MN. A new dose response calibration curve is presented in which the average rate of MN per BNC is of similar magnitude to those presented in the literature using automated CBMN slide scoring methods. In addition, dose estimates were generated for nine irradiated, blinded samples and were found to be within ±0.5 Gy of the delivered dose. Results demonstrate that the improved identification accuracy for MN and BNCs in the IS(X) -based version of the CBMN assay will translate to increased accuracy when estimating unknown radiation doses received by exposed individuals following large-scale radiological or nuclear emergencies. © 2016 The Authors. Cytometry Part A published by Wiley Periodicals, Inc. on behalf of ISAC.
Keywords: ImageStreamX; automated MN analysis; biodosimetry; cytokinesis-block micronucleus assay; imaging flow cytometry; population triage.
© 2016 The Authors. Cytometry Part A published by Wiley Periodicals, Inc. on behalf of ISAC.
Figures

Similar articles
-
Multi-parameter dose estimations in radiation biodosimetry using the automated cytokinesis-block micronucleus assay with imaging flow cytometry.Cytometry A. 2014 Oct;85(10):883-93. doi: 10.1002/cyto.a.22511. Epub 2014 Aug 25. Cytometry A. 2014. PMID: 25154929
-
THE EFFECT OF AN OPTIMIZED IMAGING FLOW CYTOMETRY ANALYSIS TEMPLATE ON SAMPLE THROUGHPUT IN THE REDUCED CULTURE CYTOKINESIS-BLOCK MICRONUCLEUS ASSAY.Radiat Prot Dosimetry. 2016 Dec;172(1-3):223-229. doi: 10.1093/rpd/ncw160. Epub 2016 Jul 15. Radiat Prot Dosimetry. 2016. PMID: 27421474
-
Automated analysis of the cytokinesis-block micronucleus assay for radiation biodosimetry using imaging flow cytometry.Radiat Environ Biophys. 2014 May;53(2):273-82. doi: 10.1007/s00411-014-0525-x. Epub 2014 Mar 7. Radiat Environ Biophys. 2014. PMID: 24604721
-
The potential for complete automated scoring of the cytokinesis block micronucleus cytome assay using imaging flow cytometry.Mutat Res Genet Toxicol Environ Mutagen. 2018 Dec;836(Pt A):53-64. doi: 10.1016/j.mrgentox.2018.05.003. Epub 2018 May 6. Mutat Res Genet Toxicol Environ Mutagen. 2018. PMID: 30389163 Review.
-
The micronucleus assay in radiation accidents.Ann Ist Super Sanita. 2009;45(3):260-4. Ann Ist Super Sanita. 2009. PMID: 19861730 Review.
Cited by
-
Machine learning approach for quantitative biodosimetry of partial-body or total-body radiation exposures by combining radiation-responsive biomarkers.Sci Rep. 2023 Jan 18;13(1):949. doi: 10.1038/s41598-023-28130-0. Sci Rep. 2023. PMID: 36653416 Free PMC article.
-
Automation of the in vitro micronucleus assay using the Imagestream® imaging flow cytometer.Cytometry A. 2018 Jul;93(7):706-726. doi: 10.1002/cyto.a.23493. Epub 2018 Aug 17. Cytometry A. 2018. PMID: 30118149 Free PMC article.
-
The in vitro micronucleus assay using imaging flow cytometry and deep learning.NPJ Syst Biol Appl. 2021 May 18;7(1):20. doi: 10.1038/s41540-021-00179-5. NPJ Syst Biol Appl. 2021. PMID: 34006858 Free PMC article.
-
Multiparameter imaging flow cytometry-based cytokinesis-block micronucleus assay: Reduction of culture time and blood volume for improved efficiency.Mutat Res Genet Toxicol Environ Mutagen. 2024 Aug-Sep;898:503792. doi: 10.1016/j.mrgentox.2024.503792. Epub 2024 Jul 5. Mutat Res Genet Toxicol Environ Mutagen. 2024. PMID: 39147444
-
The Application of Imaging Flow Cytometry to High-Throughput Biodosimetry.Genome Integr. 2017 Jan 23;8:7. doi: 10.4103/2041-9414.198912. eCollection 2017. Genome Integr. 2017. PMID: 28250914 Free PMC article. Review.
References
-
- Alexander GA, et al. BiodosEPR‐2006 meeting: Acute dosimetry consensus committee recommendations on biodosimetry applications in events involving uses of radiation by terrorists and radiation accidents. Radiat Meas 2007;42:972–996.
-
- Rea ME, Gougelet RM, Nicolalde RJ, Geiling JA, Swartz HM. Proposed triage categories for large‐scale radiation incidents using high‐accuracy biodosimetry methods. Health Phys 2010;98:136–144. - PubMed
-
- Hall EJ, Giaccia AJ. Radiobiology for the Radiologist. Philadelphia, PA: Lippincott Williams & Wilkins; 2012.
-
- Fenech M, Morley AA. Measurement of micronuclei in lymphocytes. Mutat Res 1985;147:29–36. - PubMed
-
- Fenech M, Morley AA. Cytokinesis‐block micronucleus method in human lymphocytes—Effect of in vivo aging and low dose x‐irradiation. Mutat Res 1986;161:193–198. - PubMed
MeSH terms
LinkOut - more resources
Full Text Sources
Other Literature Sources
