. 2016 Jul;48(7):768-76.
doi: 10.1038/ng.3590. Epub 2016 Jun 6.

Clonal evolution of glioblastoma under therapy

Affiliations

Clonal evolution of glioblastoma under therapy

Jiguang Wang et al. Nat Genet. 2016 Jul.

Abstract

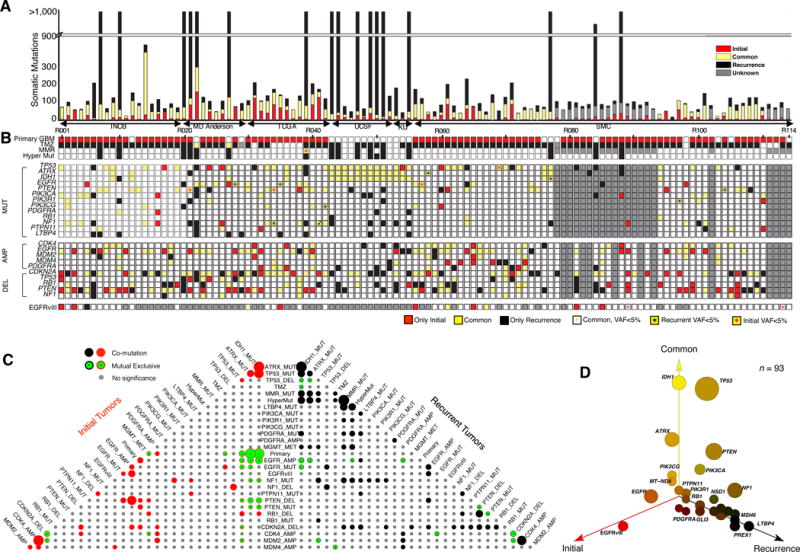
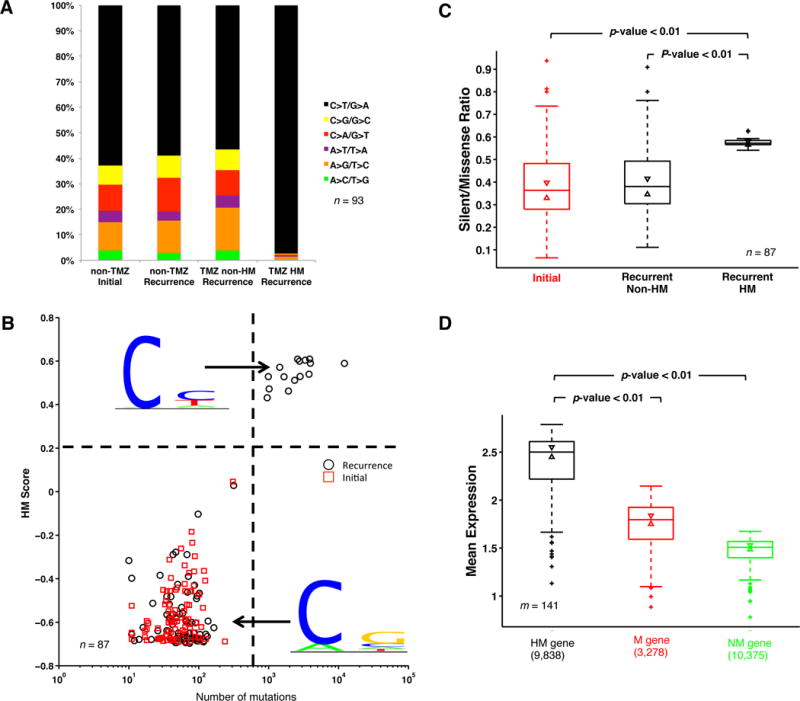
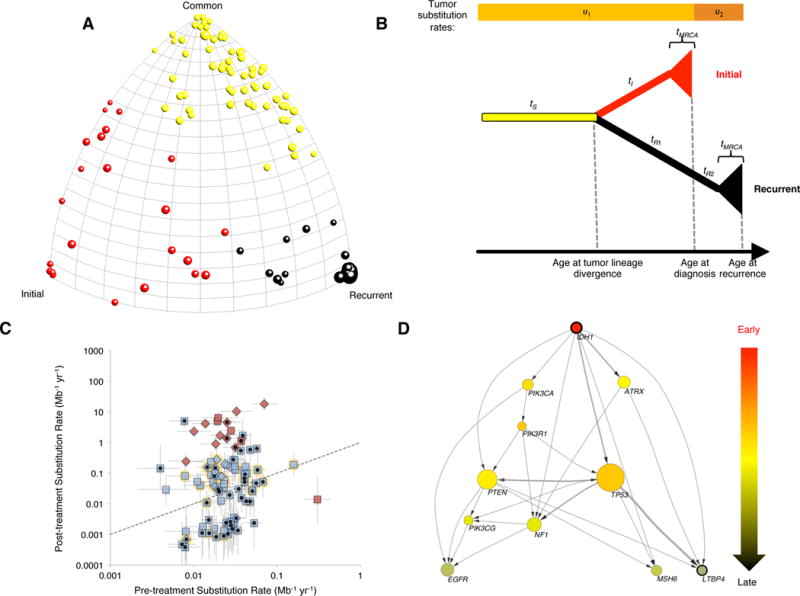
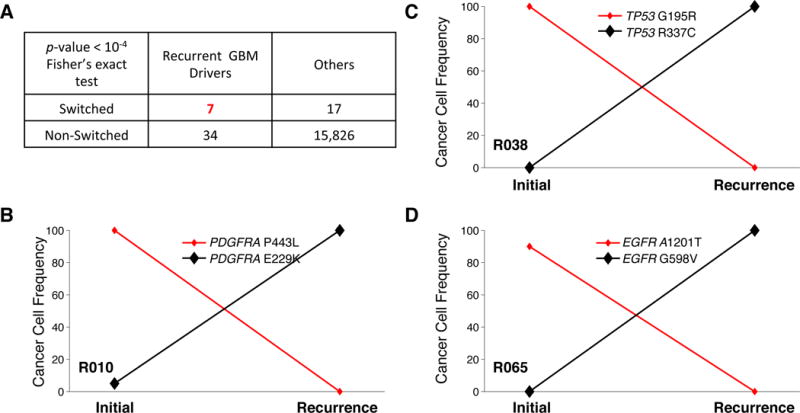
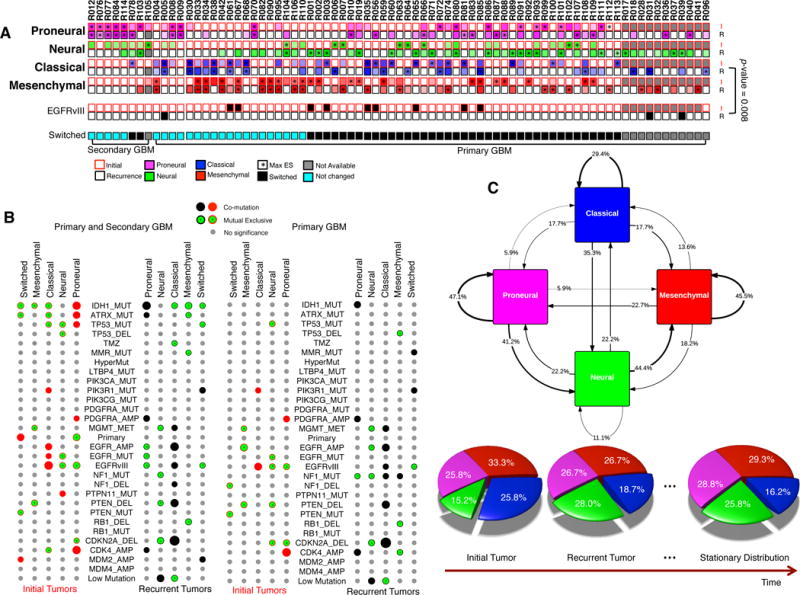
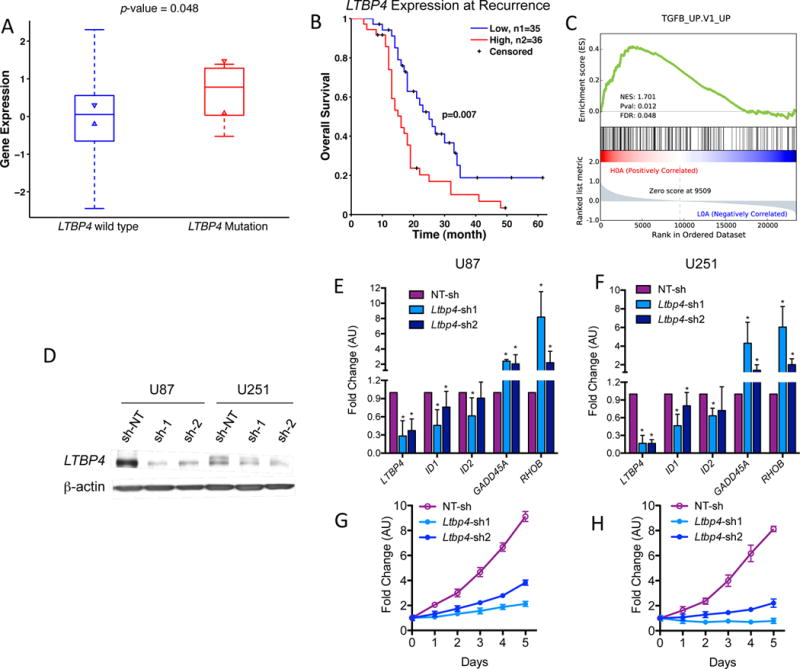
Glioblastoma (GBM) is the most common and aggressive primary brain tumor. To better understand how GBM evolves, we analyzed longitudinal genomic and transcriptomic data from 114 patients. The analysis shows a highly branched evolutionary pattern in which 63% of patients experience expression-based subtype changes. The branching pattern, together with estimates of evolutionary rate, suggests that relapse-associated clones typically existed years before diagnosis. Fifteen percent of tumors present hypermutation at relapse in highly expressed genes, with a clear mutational signature. We find that 11% of recurrence tumors harbor mutations in LTBP4, which encodes a protein binding to TGF-β. Silencing LTBP4 in GBM cells leads to suppression of TGF-β activity and decreased cell proliferation. In recurrent GBM with wild-type IDH1, high LTBP4 expression is associated with worse prognosis, highlighting the TGF-β pathway as a potential therapeutic target in GBM.


Conflict of interest statement

The authors declare no competing financial interests.

Figures

Figure 1
Figure 1. Mutation landscape of recurrent Glioblastoma
(A) Number of somatic mutations. 114 Patients from six sources (Instituto Neurologico C. Besta, MD Anderson Cancer Center, The Cancer Genome Atlas, University of California San Francisco, Kyoto University, and Samsung Medical Center). (B) Clinic and genetic profile of patients. TMZ indicates Temozolomide; MMR represents mismatch repair pathway (MSH6, MSH2, MSH4, MSH5, PMS1, PMS2, MLH1, MLH3 were considered). Hyper Mut represents hypermutation. MUT indicates somatic non-synonymous mutations with allele frequency >5% in at least one sample. AMP/DEL indicates copy number change with segmentation mean >0.5, computed either by SNP/CGH array data or by whole-exome sequencing data. TMZ represents Temozolomide. (C) Pyramids plot highlighting the correlation between different features. Hypergeometric test was performed for each pair of elements by considering Initial and recurrent tumors separately. The size of the circle indicates significance level of the correlation. Any associations with p-value < 0.1 were illustrated in this plot. (D) 3-D bubble plot illustrating the mutation frequency of somatic non-synonymous mutations in exclusively initial (red, left axis), exclusively recurrence (black, right axis), and in common (yellow, upper axis). 93 patients with exome-sequencing data in matched normal, initial tumor, and recurrent tumor were considered in this analysis.
Figure 2
Figure 2. Temozolomide (TMZ) related Hypermutation (HM)
(A) Fraction of different types of nucleotide change. In this analysis, 93 patients with trios of normal, initial and recurrent DNA data were considered. (B) HM Score and mutation load. HM logo and non-HM logo were separately calculated based on all substitutions from HM and non-HM samples. Given this, HM score of each sample was defined based on its mutation pattern. If mutations in a sample follow the pattern of HM logo, the sample will have higher HM score. Patients with less than ten mutations in either initial or recurrent samples were not considered in the analysis of B and C. (C) Silent/missense ratio analysis. P-value was calculated by Ranksum test. (D) Expression comparison between three gene clusters: HM genes, mutated (M) genes, and non-mutated (NM) genes. Mean expression of three gene clusters in samples with expression data available (m=160) was calculated to generate the box plot. The bottom and top of the box indicate first and third quartiles, and the line inside is the median. Whiskers represent 1.5 IQR. P-values were calculated by Ranksum test.
Figure 3
Figure 3. Mathematical model of tumor evolution
(A) Moduli space of GBM evolution trees. Each ball represents one patient, and different colors represent three clusters in moduli space. (B) Model of branching tumor evolution. This model assumes independent monophyletic origin for initial and recurrent tumors sharing an ancestral clonal lineage (duration tS), after which they branch off from one another (durations tI and tR1+tR2). After this clonal evolution, the lineage leading to each sample diversifies for a duration tMRCA, during which subclonal variants can accrue. Somatic variants accrue according to substitution rates u1 and u2 before and after treatment, respectively. (C) Relationship between estimated substitution rates before and after treatment, in substitutions per Mb-yr (median and interquartile range for each patient). Dashed line shows diagonal (pre- and post-substitution rates equal). Hypermutated tumors shown in red, non-hypermutated tumors in light blue. Primary GBM diagnoses shown as squares, secondary GBM diagnoses as diamonds. Black dot in center of symbol shows patients who fit the model well. Yellow halo shows patients with TP53 mutated in both the initial and recurrent samples. Patient R069 was not considered for evolutionary analysis as no valid mutations were detected in the initial sample. (D) Cross-sectional integration of longitudinal data by tumor evolutionary directed graph. Arrow represents time order of mutations. Wider arrows represent there are more independent patients containing the same order of mutation. The size of the node indicated the frequency of the mutations in our cohort.
Figure 4
Figure 4. Clonal replacement in key driver genes
(A) Mutations of seven key GBM drivers (EGFR, TP53, PDGFRA, PTEN, ATRX, NF1, and RB1) were replaced by different mutations in the same genes. (B–C) Mutational replacement in three different patients. Cancer cell frequency was estimated by Pyclone.
Figure 5
Figure 5. Expression-based Subtyping of Recurrent GBM. (A) Expression based GBM subtyping
ssGSEA was performed to cluster each sample into four subtypes (proneural, neural, classical, and mesenchymal). “*” indicates subtypes with maximal enrichment score (ES). If the optimal subtype in initial and that in recurrent tumor is different, a patient was labeled as switched. P-value was calculated by Fisher’s exact test. (B) Association between expression-based subtype switching and genetic/clinic features. The same analysis as in Figure 1C had been performed. (C) The stochastic matrix of GBM subtypes. The large cohort of longitudinal GBM samples allows the construction of probability transition matrix between four subtypes. The arrows indicate the frequency of a patient to stay a subtype or to be switched from one subtype to another. A stationary distribution was calculated based on this stochastic matrix, indicating the proportion of these four subtypes after treatment.
Figure 6
Figure 6
LTBP4 and TGFsignaling pathway in recurrent GBM. (A) LTBP4 mutation was related to its high expression. P-value was calculated by Ranksum test. (B) Survival analysis of LTBP4 expression in IDH1-wild-type primary GBM patients. High indicates z-score of LTBP4>0, while low are LTBP4<0. P-value was calculated by log rank test. Only IDH1-wild-type primary GBM patients were considered in this analysis. (C) Gene set enrichment analysis. Recurrent tumor samples from IDH1-wild-type primary GBM were grouped according to LTBP4 expression. Samples with high LTBP4 expression (z score>0) were enriched with TGF-β activity. (D) Western blot of U87 and U251 glioma cells transduced with three independent sh-RNA, two against LTBP4 (sh1 and sh2), and one non-target-shRNA (sh-NT) as control. β-actin was used as loading control. (EF) qRT-PCR of TGFβ target genes in U87 (E) and U251 (F); n = 9 (three biological replicates performed in triplicates) ± SD. Asterisk indicate statistical significance. (GH) Growth curve of a representative experiment using U87 (G) and U251 (H) glioma cells treated as in D (means of six experimental replicates) ± SD.

Similar articles

Cited by

References

    1. Ricard D, et al. Primary brain tumours in adults. Lancet. 2012;379:1984–1996. - PubMed
    1. Stupp R, et al. Radiotherapy plus concomitant and adjuvant temozolomide for glioblastoma. N Engl J Med. 2005;352:987–996. - PubMed
    1. Frattini V, et al. The integrated landscape of driver genomic alterations in glioblastoma. Nat Genet. 2013;45:1141–1149. - PMC - PubMed
    1. Brennan CW, et al. The somatic genomic landscape of glioblastoma. Cell. 2013;155:462–477. - PMC - PubMed
    1. Mazor T, et al. DNA Methylation and Somatic Mutations Converge on the Cell Cycle and Define Similar Evolutionary Histories in Brain Tumors. Cancer Cell. 2015;28:307–317. - PMC - PubMed

MeSH terms