A multi-model statistical approach for proteomic spectral count quantitation
- PMID: 27260494
- PMCID: PMC4967010
- DOI: 10.1016/j.jprot.2016.05.032
A multi-model statistical approach for proteomic spectral count quantitation
Abstract
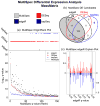
The rapid development of mass spectrometry (MS) technologies has solidified shotgun proteomics as the most powerful analytical platform for large-scale proteome interrogation. The ability to map and determine differential expression profiles of the entire proteome is the ultimate goal of shotgun proteomics. Label-free quantitation has proven to be a valid approach for discovery shotgun proteomics, especially when sample is limited. Label-free spectral count quantitation is an approach analogous to RNA sequencing whereby count data is used to determine differential expression. Here we show that statistical approaches developed to evaluate differential expression in RNA sequencing experiments can be applied to detect differential protein expression in label-free discovery proteomics. This approach, termed MultiSpec, utilizes open-source statistical platforms; namely edgeR, DESeq and baySeq, to statistically select protein candidates for further investigation. Furthermore, to remove bias associated with a single statistical approach a single ranked list of differentially expressed proteins is assembled by comparing edgeR and DESeq q-values directly with the false discovery rate (FDR) calculated by baySeq. This statistical approach is then extended when applied to spectral count data derived from multiple proteomic pipelines. The individual statistical results from multiple proteomic pipelines are integrated and cross-validated by means of collapsing protein groups.
Biological significance: Spectral count data from shotgun proteomics experiments is semi-quantitative and semi-random, yet a robust way to estimate protein concentration. Tag-count approaches are routinely used to analyze RNA sequencing data sets. This approach, termed MultiSpec, utilizes multiple tag-count based statistical tests to determine differential protein expression from spectral counts. The statistical results from these tag-count approaches are combined in order to reach a final MultiSpec q-value to re-rank protein candidates. This re-ranking procedure is completed to remove bias associated with a single approach in order to better understand the true proteomic differences driving the biology in question. The MultiSpec approach can be extended to multiple proteomic pipelines. In such an instance, MultiSpec statistical results are integrated by collapsing protein groups across proteomic pipelines to provide a single ranked list of differentially expressed proteins. This integration mechanism is seamlessly integrated with the statistical analysis and provides the means to cross-validate protein inferences from multiple proteomic pipelines.
Keywords: DESeq; Proteomics; Spectral Counting; baySeq; edgeR; q-Value.
Copyright © 2016 Elsevier B.V. All rights reserved.
Figures


Similar articles
-
Comparative analysis of statistical methods used for detecting differential expression in label-free mass spectrometry proteomics.J Proteomics. 2015 Nov 3;129:83-92. doi: 10.1016/j.jprot.2015.07.012. Epub 2015 Jul 18. J Proteomics. 2015. PMID: 26193490
-
Tag-Count Analysis of Large-Scale Proteomic Data.J Proteome Res. 2016 Dec 2;15(12):4742-4746. doi: 10.1021/acs.jproteome.6b00554. Epub 2016 Nov 10. J Proteome Res. 2016. PMID: 27797532 Free PMC article.
-
On the beta-binomial model for analysis of spectral count data in label-free tandem mass spectrometry-based proteomics.Bioinformatics. 2010 Feb 1;26(3):363-9. doi: 10.1093/bioinformatics/btp677. Epub 2009 Dec 9. Bioinformatics. 2010. PMID: 20007255
-
Role of spectral counting in quantitative proteomics.Expert Rev Proteomics. 2010 Feb;7(1):39-53. doi: 10.1586/epr.09.69. Expert Rev Proteomics. 2010. PMID: 20121475 Review.
-
Methods and Algorithms for Quantitative Proteomics by Mass Spectrometry.Methods Mol Biol. 2020;2051:161-197. doi: 10.1007/978-1-4939-9744-2_7. Methods Mol Biol. 2020. PMID: 31552629 Review.
Cited by
-
The DREAM complex represses growth in response to DNA damage in Arabidopsis.Life Sci Alliance. 2021 Sep 28;4(12):e202101141. doi: 10.26508/lsa.202101141. Print 2021 Dec. Life Sci Alliance. 2021. PMID: 34583930 Free PMC article.
-
Simultaneous Improvement in the Precision, Accuracy, and Robustness of Label-free Proteome Quantification by Optimizing Data Manipulation Chains.Mol Cell Proteomics. 2019 Aug;18(8):1683-1699. doi: 10.1074/mcp.RA118.001169. Epub 2019 May 16. Mol Cell Proteomics. 2019. PMID: 31097671 Free PMC article.
-
Extended Multiplexing of Tandem Mass Tags (TMT) Labeling Reveals Age and High Fat Diet Specific Proteome Changes in Mouse Epididymal Adipose Tissue.Mol Cell Proteomics. 2017 May;16(5):873-890. doi: 10.1074/mcp.M116.065524. Epub 2017 Mar 21. Mol Cell Proteomics. 2017. PMID: 28325852 Free PMC article.
-
The human tubal lavage proteome reveals biological processes that may govern the pathology of hydrosalpinx.Sci Rep. 2019 Jun 20;9(1):8980. doi: 10.1038/s41598-019-44962-1. Sci Rep. 2019. PMID: 31222072 Free PMC article.
-
Sex Differences in the Ventral Tegmental Area and Nucleus Accumbens Proteome at Baseline and Following Nicotine Exposure.Front Mol Neurosci. 2021 Jul 14;14:657064. doi: 10.3389/fnmol.2021.657064. eCollection 2021. Front Mol Neurosci. 2021. PMID: 34335180 Free PMC article.
References
-
- Mallick P, Kuster B. Proteomics: a pragmatic perspective. Nature biotechnology. 2010;28:695–709. - PubMed
-
- Liu H, Sadygov RG, Yates JR., 3rd A model for random sampling and estimation of relative protein abundance in shotgun proteomics. Analytical chemistry. 2004;76:4193–201. - PubMed
-
- Lundgren DH, Hwang SI, Wu L, Han DK. Role of spectral counting in quantitative proteomics. Expert review of proteomics. 2010;7:39–53. - PubMed
-
- Old WM, Meyer-Arendt K, Aveline-Wolf L, Pierce KG, Mendoza A, Sevinsky JR, et al. Comparison of label-free methods for quantifying human proteins by shotgun proteomics. Molecular & cellular proteomics : MCP. 2005;4:1487–502. - PubMed
-
- Patel VJ, Thalassinos K, Slade SE, Connolly JB, Crombie A, Murrell JC, et al. A comparison of labeling and label-free mass spectrometry-based proteomics approaches. J Proteome Res. 2009;8:3752–9. - PubMed
Publication types
MeSH terms
Substances
Grants and funding
LinkOut - more resources
Full Text Sources
Other Literature Sources

