. 2016 Jun 14;113(24):6677-82.
doi: 10.1073/pnas.1602875113. Epub 2016 May 31.

Sphingomyelin is sorted at the trans Golgi network into a distinct class of secretory vesicle

Affiliations

Sphingomyelin is sorted at the trans Golgi network into a distinct class of secretory vesicle

Yongqiang Deng et al. Proc Natl Acad Sci U S A. .

Abstract

One of the principal functions of the trans Golgi network (TGN) is the sorting of proteins into distinct vesicular transport carriers that mediate secretion and interorganelle trafficking. Are lipids also sorted into distinct TGN-derived carriers? The Golgi is the principal site of the synthesis of sphingomyelin (SM), an abundant sphingolipid that is transported. To address the specificity of SM transport to the plasma membrane, we engineered a natural SM-binding pore-forming toxin, equinatoxin II (Eqt), into a nontoxic reporter termed Eqt-SM and used it to monitor intracellular trafficking of SM. Using quantitative live cell imaging, we found that Eqt-SM is enriched in a subset of TGN-derived secretory vesicles that are also enriched in a glycophosphatidylinositol-anchored protein. In contrast, an integral membrane secretory protein (CD8α) is not enriched in these carriers. Our results demonstrate the sorting of native SM at the TGN and its transport to the plasma membrane by specific carriers.

Keywords: Golgi apparatus; equinatoxin; secretion; sphingomyelin.


Conflict of interest statement

The authors declare no conflict of interest.

Figures
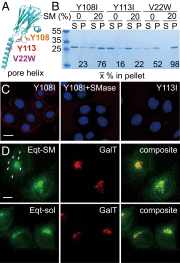
Fig. 1.
Fig. 1.
Membrane-binding properties and localization of Eqt derivatives. (A) Location of mutations introduced into Eqt. The structure of an actinoporin (FraC) protomer in its oligomeric pore-forming conformation (28) is rendered, with mutations that we introduced indicated. A residue on the N-terminal helix, V22, which was changed to tryptophan to ablate pore formation, is shown in purple. Y108, which was changed to isoleucine in Eqt-SM, is in orange, and Y113, which was changed to isoleucine in Eqt-sol, is in red. (B) Vesicle-binding assays. The indicated Eqt proteins were incubated with vesicles containing 20% SM or phosphatidylcholine (and 20% cholesterol), and the vesicles were collected by centrifugation. Bound pellet (P) and unbound supernatant (S) fractions were visualized by Coomassie blue staining and quantified. The mean values of three independent experiments are shown. Molecular mass standards (kDa) are indicated on the left. The Y108 and Y113 mutants also include the V22W mutation. (C) Eqt-V22W,Y108I recognizes SM in the plasma membrane of intact cells. Recombinant FLAG epitope-tagged Eqt-Y108I or Eqt-Y113I was incubated with HeLa cells that had been incubated with SMase or mock-treated. Cells were then washed, fixed, and incubated with anti-FLAG and labeled secondary antibodies. (D) Localization of Eqt-SM and Eqt-sol in HeLa cells. Plasmids encoding the indicated proteins were transfected into HeLa cells and visualized by deconvolution florescence microscopy at 16 h after transfection. The arrows point to examples of cytoplasmic puncta that contain Eqt-SM. Maximum projections of z series are shown. (Scale bar: 10 μm.)
Fig. S1.
Fig. S1.
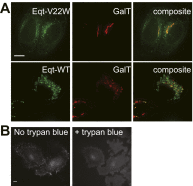
Localization of Eqt WT and V22W and trypan blue quenches fluorescence of Eqt-SM-pHlourin. (A) Localization of Eqt-V22W and native Eqt in HeLa cells. Plasmids encoding the indicated proteins were transfected into HeLa cells and visualized by deconvolution florescence microscopy at 16 h after transfection. Maximum projections of a z series are shown. (Scale bar: 10 μm.) (B, Left) Cells expressing Eqt-SM-pHlourin before the addition of trypan blue to the culture medium. (B, Right) The same cells photographed ∼30 s after addition of trypan blue (concentration) to the culture medium. Maximum projections of a z series are shown. (Scale bar: 10 μm.)
Fig. S2.
Fig. S2.
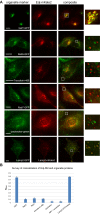
Eqt-SM does not localize to organelles of the endolysosomal system. (A) Plasmids encoding the indicated proteins were transfected into HeLa cells and visualized by deconvolution florescence microscopy at 16 h after transfection. Maximum projections of a z series are shown. (Scale bar: 10 μm.) (B) Average Pearson correlation coefficients (Rave) for Eqt-SM and various endolysosomal markers were calculated for a minimum of 30 cells in three experiments. To provide benchmarks for interpreting these values, we included a positive control for colocalization, Lamp2-GFP and Lamp2-mKate2, and a negative control for colocalization (NPY-GFP, a soluble, secreted protein) and LysoTracker (Thermo Fisher Scientific).
Fig. 2.
Fig. 2.
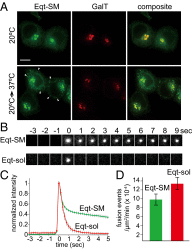
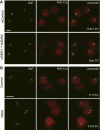
Vesicles containing engineered Eqt fuse with the plasma membrane. (A) Blockage of export from the Golgi results in retention of Eqt-SM. HeLa cells expressing Eqt-SM (tagged with oxGFP) were incubated at 20 °C for 2 h (top row) to arrest export from the TGN and then transferred to 37 °C for 30 min. The arrows point to cytoplasmic puncta containing Eqt-SM that appeared after release of the 20 °C Golgi export block. Maximum projections of a z series are shown. (Scale bar: 10 μm.) (B) Representative TIRFM frames for Eqt-SM and Eqt-sol. (C) TIRFM showing vesicles containing Eqt-SM and Eqt-sol fused with the plasma membrane. The green and red traces indicate the average normalized fluorescence intensities for Eqt-SM (n = 413) and Eqt-sol (n = 268) vesicle fusion events, respectively (prefusion intensity defined as 0; postfusion intensity defined as 1). SDs for each point are shown. (D) Rates of Eqt-SM and Eqt-sol exocytic events as determined by TIRFM imaging and expressed as the number of fusion events per area (μm2) per time (min). SEMs are indicated. The rates are not statistically different (P ≤ 0.06).
Fig. 3.
Fig. 3.
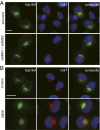
Export of Eqt-SM from the Golgi is promoted by SM synthesis. (A) Eqt-SM accumulates in the Golgi of SMS1 and SMS2 RNAi cells. HeLa cells were transfected with siRNAs for 2 d, followed by transfected plasmids that direct expression of Eqt-SM and GalT-mKate2, and visualized by deconvolution florescence microscopy at 16 h after the second transfection. Nuclear DNA was stained with Hoechst 33342. Maximum projections of a z series are shown. (Scale bar: 10 μm.) (B) Eqt-SM accumulates in the Golgi of cells treated with D609, a small-molecule inhibitor of SM synthesis. HeLa cells transfected with plasmids that direct expression of Eqt-SM and GalT-mKate2 were incubated with D609 (200 μM) for 4 h. Maximum projections of a z series are shown. (Scale bar: 10 μm.)
Fig. S3.
Fig. S3.
Inhibition of SM synthesis does not ablate the Golgi pool of DAG. DAG was detected in the Golgi of SMS1 and SMS2 RNAi cells (A) and in the Golgi of cells treated with D609 (B). Cells were transfected with a plasmid that directs the expression of a GST-tagged C2 domain of protein kinase D, a DAG biosensor (37), which was detected by anti-GST immunofluorescence. The proportions of PKD_C2 fluorescence that localize to the Golgi are indicated in each micrograph (mean ± SD; n > 20). (Scale bars: 10 μm.)
Fig. S4.
Fig. S4.
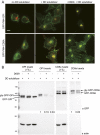
Inhibition of SM synthesis results in accumulation of GPI in the Golgi. (A) HeLa cells expressing GFP-FM4-GPI or GFP-FM4-CD8α (and Eqt-SM-mKate2) were incubated with D609 for 3 h before addition of the solubilizer molecule to release GPI and CD8α into the secretory pathway. In the absence of the disaggregating molecule (Left, “no solubilizer”), GPI or CD8α is retained in the ER. In the absence of D609, at 45 min after addition of disaggregating molecule (Center, “+ solubilizer”), both GPI and CD8 localize prominently to the plasma membrane. In cells incubated with D609 for 3 h before addition of disaggregating molecule (Right, “+ D609 + solubilizer”), GPI accumulates in the Golgi, whereas CD8α continues to be delivered to the plasma membrane. (Scale bar: 10 μm.) (B) Surface biotinylation of cells prepared as described in A. After incubation of cells with a membrane-impermeable biotinylation reagent, lysates were generated (1% shown), and biointylated proteins were captured on NeutrAvidin beads. Captured proteins were resolved and observed by SDS/PAGE and anti-GFP immunoblotting. Arrows indicate the positions of the unmodified and secreted, glycosylated (gly) forms of the proteins. Anti-actin blots report cell integrity. Molecular mass standards (kDa) are indicated.
Fig. 4.
Fig. 4.
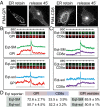
Eqt-SM and GPI are cosorted into secretory vesicles. (A) Trafficking of GPI and CD8α reporter proteins. HeLa cells were transfected with plasmids that direct expression of mKate2-FM4-GPI or mKate2-FM4-CD8α. In the absence of the disaggregating molecule (“ER retain”) mKate2-FM4-GPI and mKate2-FM4-CD8α are retained in the ER. Incubation of cells with the disaggregating molecule (“release 45’”) releases GPI and CD8α from the ER, and they are subsequently trafficked to the cell surface. The micrographs show cells incubated with solubilizer for 45 min. (B and C) Example TIRFM time-lapse gallery of Eqt-SM, Eqt-sol, and GPI (B) and mKate2-FM4-CD8α (C) exocytic events. GPI and CD8α reporters were coexpressed in cells with Eqt-SM-pHlourin or Eqt-sol-pHlourin and released from the ER of cells by the addition of solubilizer drug. Exocytic events were recorded by TIRFM beginning 30 min after ER release. The graphs show fluorescence intensity in each channel over time. (D) Summary of Eqt vesicle cargo content and GPI-containing vesicle content. The proportions of exocytic vesicles containing the indicated cargos (mean ± SD) are listed. The number of fusion events scored for each condition are as follows: Eqt-SM+CD8, n = 146; Eqt-SM+GPI, n = 157; Eqt-sol+CD8, n = 153; Eqt-sol+GPI, n = 136; GPI+Eqt-SM, n = 85; GPI+Eqt-sol, n = 65.
Fig. 5.
Fig. 5.
Eqt-SM and GPI are cosorted into vesicles that bud from the Golgi. (A) Time-lapse galleries showing example Golgi budding events. The fluorescent proteins (mKate2-FM4-GPI or mKate2-FM4-CD8α) were released from the ER of HeLa cells stably expressing Eqt-SM-oxGFP, and image acquisition of the Golgi region was initiated 30 min later. An example of a vesicle containing both Eqt-SM and GPI is shown at top, and an example of vesicle that contains CD8α, but not Eqt-SM, is shown below. (B) Time-lapse gallery of the Golgi region of a HeLa cell expressing SBP-mKate2-GPI and eGFP-FM4-CD8α, showing examples of each reporter protein being exported from the Golgi in distinct carriers. (C) Summary of cargo loads of vesicles that bud from the Golgi. The means ± SDs of Eqt-SM-oxGFP budding events in cells expressing mKate2-FM4-GPI (n = 33), mKate2-FM4-CD8α (n = 26), and SBP-mKate2-GPI and eGFP-FM4-CD8α (n = 69) are shown.

Similar articles

Cited by

References

    1. De Matteis MA, Luini A. Exiting the Golgi complex. Nat Rev Mol Cell Biol. 2008;9(4):273–284. - PubMed
    1. Litvak V, Dahan N, Ramachandran S, Sabanay H, Lev S. Maintenance of the diacylglycerol level in the Golgi apparatus by the Nir2 protein is critical for Golgi secretory function. Nat Cell Biol. 2005;7(3):225–234. - PubMed
    1. Villani M, et al. Sphingomyelin synthases regulate production of diacylglycerol at the Golgi. Biochem J. 2008;414(1):31–41. - PMC - PubMed
    1. Subathra M, Qureshi A, Luberto C. Sphingomyelin synthases regulate protein trafficking and secretion. PLoS One. 2011;6(9):e23644. - PMC - PubMed
    1. Tafesse FG, et al. Intact sphingomyelin biosynthetic pathway is essential for intracellular transport of influenza virus glycoproteins. Proc Natl Acad Sci USA. 2013;110(16):6406–6411. - PMC - PubMed

Publication types

MeSH terms

LinkOut - more resources