. 2016 Jul 5;7(27):41081-41094.
doi: 10.18632/oncotarget.9596.

Interferon regulatory factor 4 attenuates Notch signaling to suppress the development of chronic lymphocytic leukemia

Affiliations

Interferon regulatory factor 4 attenuates Notch signaling to suppress the development of chronic lymphocytic leukemia

Vipul Shukla et al. Oncotarget. .

Abstract

Molecular pathogenesis of Chronic Lymphocytic Leukemia (CLL) is not fully elucidated. Genome wide association studies have linked Interferon Regulatory Factor 4 (IRF4) to the development of CLL. We recently established a causal relationship between low levels of IRF4 and development of CLL. However, the molecular mechanism through which IRF4 suppresses CLL development remains unclear. Deregulation of Notch signaling pathway has been identified as one of the most recurrent molecular anomalies in the pathogenesis of CLL. Yet, the role of Notch signaling as well as its regulation during CLL development remains poorly understood. Previously, we demonstrated that IRF4 deficient mice expressing immunoglobulin heavy chain Vh11 (IRF4-/-Vh11) developed spontaneous CLL with complete penetrance. In this study, we show that elevated Notch2 expression and the resulting hyperactivation of Notch signaling are common features of IRF4-/-Vh11 CLL cells. Our studies further reveal that Notch signaling is indispensable for CLL development in the IRF4-/-Vh11 mice. Moreover, we identify E3 ubiquitin ligase Nedd4, which targets Notch for degradation, as a direct target of IRF4 in CLL cells and their precursors. Collectively, our studies provide the first in vivo evidence for an essential role of Notch signaling in the development of CLL and establish IRF4 as a critical regulator of Notch signaling during CLL development.

Keywords: B1 cells; CLL; IRF4; Notch signaling.


Conflict of interest statement

The authors declare no conflict of interest.

Figures

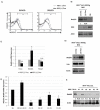
Figure 1
Figure 1. IRF4−/−Vh11 CLL cells display hyperactive Notch signaling and express high levels of Notch2 receptor
A. Western-blot analysis to detect the levels of Hes1 protein in IRF4−/−Vh11 CLL cells compared to IRF4+/+Vh11 B cells isolated from spleen. Each lane represents CLL cells from an IRF4−/−Vh11 mouse. B. Western-blot to detect the levels of Notch2 and Notch1 proteins in IRF4−/−Vh11 CLL cells. Each lane represents an individual CLL sample. Thymus is used as a positive control for Notch1 protein and actin is used as loading control. C. Histograms showing Notch2 cell surface staining in IRF4−/−Vh11 CLL cells compared to IRF4+/+Vh11 B cells as detected by Flow cytometry. Left panel shows isotype control antibody (IgG) staining and right panel shows Notch2 staining. Gray line represents gating on IRF4+/+Vh11 B cells and black line indicates IRF4−/−Vh11 CLL cells. The data shown is representative of at least three independent experiments.
Figure 2
Figure 2. Notch signaling promotes the survival and proliferation of B1 cells and CLL cells
A. Flow cytometry analysis showing the BrDU incorporation assay for cell proliferation of CD19cre control and CD19cre Notch2fl/fl B1 cells co-cultured with S17-R1 and S17-DL1 stromal-cells for 48 hours. The numbers in the upper right quadrant of each dot plot represents the percentage of BrDU positive cells. B. Bar graphs showing the statistical analysis of BrDU incorporation assay from three independent experiments. The data is represented as fold change in proliferation observed on S17-DL1 stromal-cells compared to S17-R1 control stromal-cells. C. Flow cytometry analysis showing Annexin V staining to detect apoptotic cells among CD19cre and CD19cre Notch2fl/fl B1 cells cultured with S17-R1 and S17-DL-1 stromal-cells for 48 hours. The numbers in each dot plot represents the percentage of Annexin V positive cells in the upper right quadrant. D. Bar graph showing the statistical analysis of Annexin V staining of CD19cre and CD19cre Notch2fl/fl B1 cells from five independent experiments. The data is represented as fold change in proliferation observed on S17-DL1 stromal-cells compared to S17-R1 control stromal-cells. E. Histograms representing CFSE dye dilution experiment to measure proliferation of IRF4−/−Vh11 CLL cells co-cultured with S17-R1 (black line) and S17-DL1 (gray line) stromal-cells. Black line represents CLL cells cultured on S17-R1 stromal-cells and gray line represents. F. Bar graphs showing the percentages of Annexin V positive IRF4−/−Vh11 CLL cells co-cultured with S17-R1 and S17-DL1 stromal-cells from three independent experiments. *p value ≤0.01. **p value ≤0.05.
Figure 3
Figure 3. Notch2 receptor is critical for CLL development in IRF4−/−Vh11 mice
A. Kaplan Meier Survival analysis (log-rank test) for CLL development in CD19creNotch2fl/flIRF4−/−Vh11 mice (n = 11) (dashed line) compared to CD19creIRF4−/−Vh11 mice (n = 18) (solid line). Blood was analyzed biweekly to monitor CLL development that is considered as an event represented on Y-axis. X-axis represents time in weeks. B. Left panel shows flow cytometry staining of IgM and B220 in CD19creNotch2fl/flIRF4−/−Vh11 mice. Normal untransformed B cells are IgM+ and B220 high (Gate 1) and CLL cells are IgM+ and B220 medium/dim (Gate 2). Right panel shows histograms representing IgG (gray line) or Notch2 (black line) staining in Normal B cells and CLL cells from Blood, Peritoneal Cavity (PC) and Spleen. C. Bar graph showing qRT-PCR data representing absolute Notch2 deletion efficiencies. A deletion efficiency of 47 as observed in CD19creNotch2fl/fl B cells signifies 47% notch2 gene deletion. Box1 contains B1 (CLL precursors) and B2 (normal B) cells from CD19cre Notch2fl/flIRF4−/−Vh11 mice without overt signs of CLL. Box2 encloses Notch2 deletion efficiencies in CLL and B2 cells from four different CD19creNotch2fl/flIRF4−/−Vh11 mice with overt CLL. *p value ≤0.001 **p value ≤0.01.
Figure 4
Figure 4. IRF4 regulates E3 ubiquitin ligase Nedd4 in CLL cells
A. Histograms showing Notch2 staining in CLL cells isolated from blood and spleen of NSG mice fed with (black line) or without dox water for 3 weeks (gray line). B. Western-blot analysis to detect Notch and IRF4 levels in CLL cells isolated from NSG mice fed with or without dox water for 3 weeks. The numbers below represents normalized relative expression. B cells isolated from B6 mice are used as a measure of endogenous levels of IRF4. Actin is used as loading control. C. Bar graph representing the relative mRNA expression of Hes1, Nedd4 and Fbxw7 in CLL cells isolated from NSG mice fed with or without dox water for 3 weeks. D. Western-blot analysis to measure Nedd4 and Itch protein levels in NSG mice fed with or without dox. E. Bar graph showing the relative mRNA expression of Nedd4 in four different IRF4−/−Vh11 CLL samples compared to B cells isolated from wildtype B6 and IRF4+/+Vh11 mice. F. Western-blot analysis to measure the levels of Nedd4 protein in IRF4−/−Vh11 CLL samples compared to IRF4+/+Vh11 B cells. The numbers at the bottom represents Nedd4 expression measured by densitometric analysis using ImageJ software. Actin is used as the loading control. *p value ≤0.01 **p value ≤0.05.
Figure 5
Figure 5. IRF4 directly binds to nedd4 gene
A. ChIP-seq data showing endogenous IRF4 binding at nedd4 gene locus in B1 cells isolated from IRF4+/+Vh11 mice. Immunoprecipitation of DNA fragments using anti-IRF4 antibody from IRF4−/−Vh11 B1 cells is used as control. TSS represents transcription start site and ISRE represents Interferon Stimulated Response Elements located in nedd4 gene promoter. B. ChIP-seq data showing IRF4 binding to the 3′ kappa light chain enhancer used as positive control in IRF4+/+Vh11 B1 cells. C. Bar graph representing the data from conventional ChIP assay in B1 cells using IgG and anti IRF4 antibody. Kappa represents primers spanning the 3′ enhancer in the Kappa Ig light chain locus used as positive control for IRF4 binding. The data shown in C. is representative of three independent experiments. *p value ≤0.01.
Figure 6
Figure 6. IRF4 regulates Nedd4 expression in B1 but not B2 cells
A. Western-blot showing the levels of Nedd4, Notch2, Hes1 and IRF4 in IRF4−/− B1 cells compared to IRF4+/+ B1 cells. The numbers below represent normalized relative expression calculated by densitometric quantification of respective proteins. B. Bar graph showing the relative mRNA expression of Nedd4 and Fbxw7 in IRF4−/− and IRF4+/+ B1 cells. C. Bar graph showing the relative mRNA expression of Nedd4 and Fbxw7 in IRF4−/− and IRF4+/+ B2 cells. D. Western-blot analysis to detect the levels of Pu.1 in B1 cells isolated from PC and B2 cells isolated from spleen of wild type mice. E. Flow cytometry analysis using intracellular staining to measure the levels of IRF4 in PC B1 cells and splenic B2 cells. The histograms represents intracellular staining with isotype control antibody (left panel) and with IRF4 antibody (right panel). Gray line represents B2 cells and Black line represents B1 cells. Cells were gated specifically on B1 and B2 populations based on IgM and B220 staining. *p value ≤0.01.
Figure 7
Figure 7. IRF4 regulates Nedd4 expression in human B cells and CLL cells to downregulate Notch protein
A. Western-blot showing Nedd4, IRF4, Notch2, Notch1, Hes1 and Actin expression upon IRF4 knockdown using an IRF4 specific (IRF4) or scrambled control (Con) siRNA in normal human B cells isolated from healthy donors. The numbers below represents normalized relative expression. B. Bar graph showing relative mRNA expression of IRF4, Nedd4, Hes1 and Fbxw7 in normal human B cells in control versus IRF4 specific siRNA. C. Western blot analysis showing Nedd4 and IRF4 expression in human CLL samples represented by each individual lane. D. Scatter plot to show the correlation between IRF4 and Nedd4 protein expression in human CLL cells. The dotted line represents the linear trend line. Pearson correlation coefficient (r) value is 0.865. E. Western-blot analysis of Nedd4, Itch, Notch1, Notch2 and IRF4 following Nedd4 knockdown using siRNA in human Mec-1 CLL cells. Knockdown with scrambled siRNA is used as controls (con). The numbers below represent the normalized relative expression of respective genes measured by densitometric analysis. (PBMCs).*p value ≤0.0001 **p value ≤0.01.

Similar articles

Cited by

References

    1. Fabbri G, Khiabanian H, Holmes AB, Wang J, Messina M, Mullighan CG, Pasqualucci L, Rabadan R, Dalla-Favera R. Genetic lesions associated with chronic lymphocytic leukemia transformation to Richter syndrome. The Journal of experimental medicine. 2013;210:2273–2288. - PMC - PubMed
    1. Fabbri G, Rasi S, Rossi D, Trifonov V, Khiabanian H, Ma J, Grunn A, Fangazio M, Capello D, Monti S, Cresta S, Gargiulo E, Forconi F, Guarini A, Arcaini L, Paulli M, et al. Analysis of the chronic lymphocytic leukemia coding genome: role of NOTCH1 mutational activation. The Journal of experimental medicine. 2011;208:1389–1401. - PMC - PubMed
    1. Kiel MJ, Velusamy T, Betz BL, Zhao L, Weigelin HG, Chiang MY, Huebner-Chan DR, Bailey NG, Yang DT, Bhagat G, Miranda RN, Bahler DW, Medeiros LJ, Lim MS, Elenitoba-Johnson KS. Whole-genome sequencing identifies recurrent somatic NOTCH2 mutations in splenic marginal zone lymphoma. The Journal of experimental medicine. 2012;209:1553–1565. - PMC - PubMed
    1. Puente XS, Bea S, Valdes-Mas R, Villamor N, Gutierrez-Abril J, Martin-Subero JI, Munar M, Rubio-Perez C, Jares P, Aymerich M, Baumann T, Beekman R, Belver L, Carrio A, Castellano G, Clot G, et al. Non-coding recurrent mutations in chronic lymphocytic leukaemia. Nature. 2015;526:519–524. - PubMed
    1. Puente XS, Pinyol M, Quesada V, Conde L, Ordonez GR, Villamor N, Escaramis G, Jares P, Bea S, Gonzalez-Diaz M, Bassaganyas L, Baumann T, Juan M, Lopez-Guerra M, Colomer D, Tubio JM, et al. Whole-genome sequencing identifies recurrent mutations in chronic lymphocytic leukaemia. Nature. 2011;475:101–105. - PMC - PubMed

MeSH terms

LinkOut - more resources